As mentioned in our previous Ethereum price prediction, Eth price perfectly met the measured target of the ascending wedge breakout. However, the price faced a brutal rejection from the $1,664 level and now trading significantly below that level. At the time of writing, Ethereum is trading at $1,479, gaining 5..4% in the past 24H. However, it is still 70% down from its November 2021 all-time high of $4,878.
Ethereum has been leading the crypto market recovery for the past two weeks as its price almost doubled from the June low of $881.The rally in Ethereum price has also triggered a similar price action in most medium-capped altcoins. Nevertheless, all eyes are on today’s FOMC meeting, and huge volatility is expected within the next 48 hrs.
Since the announcement of the tentative date for Ethereum 2.0, the price has been on a bullish trajectory. Many analysts are coming up with bullish ETH price predictions of up to $3,000 due to all the bullish Ethereum news. Nevertheless, the biggest hurdle in fulfilling all bullish predictions could be a further increase in interest rates by US FED.
Ethereum Price Prediction
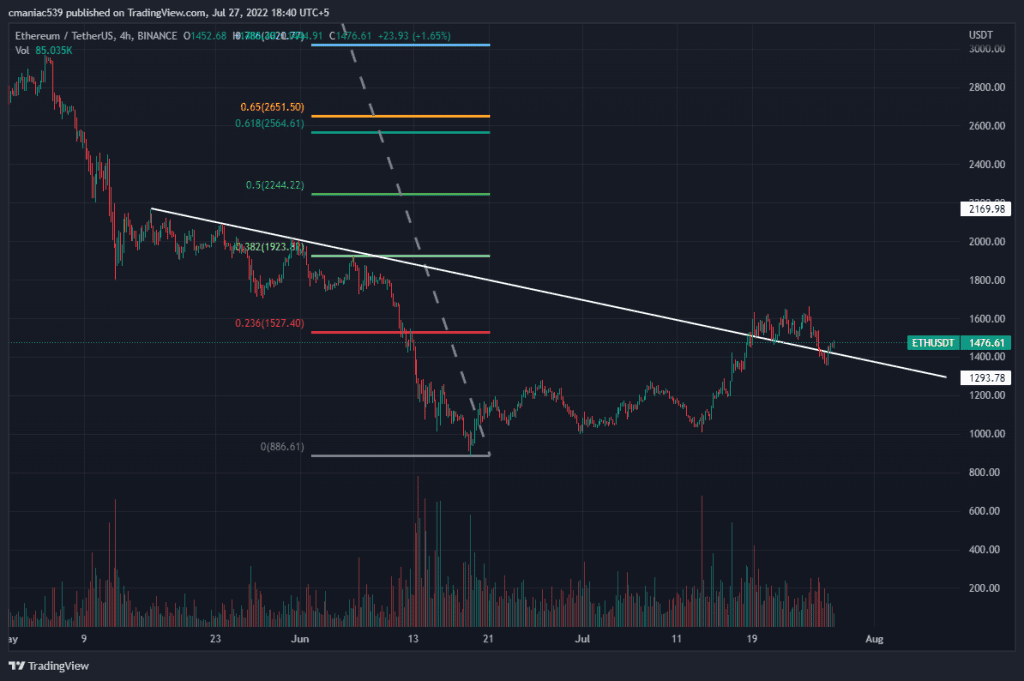
Technical analysis of the ETH USD price chart shows a retest of the downwards trendline after the recent breakout. On Tuesday, Ethereum price dipped to $1,356 as the volatility increased before the FOMC meeting. However, the dip was bought by short-term traders and is now priced at $1,479. If the FED announces another rate hike of more than 75 basis points, then ETH may dip to the $1263 level.
This level also perfectly aligns with a demand zone and 0.618 Fib retracement level. As long as our mid-term Ethereum price prediction is concerned, the coin could quickly soar to $1,925 before the merge. This is because this is a 0.382 Fib level connecting the April high to the June low. A reclaim of this level might also give the price enough momentum to target the $2,564 level. However, it must be noted that this analysis would need a revision if Bitcoin plunges below $20k once again.
ETH USD 4H Chart
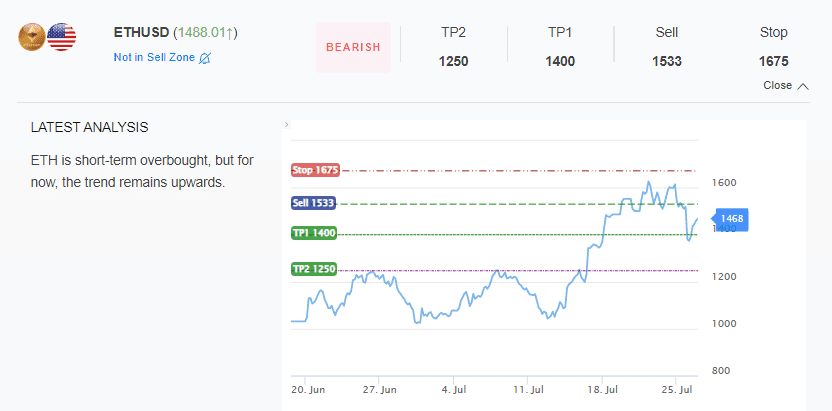
InvestingCube’s Premium S&R Indicator
If you’re trading in these choppy market conditions, then it is highly recommended to subscribe to an accurate market indicator like InvestingCube’s Premium S&R Levels. This indicator generates trade alerts whenever there is a good trade setup.
At the moment, the short-term outlook of this indicator is bearish, and it recommends selling at $1,533. The stop loss for this trade must be kept at $1675. You can trade such setups on notable crypto exchanges like Binance, Kucoin and BYBIT. For a long-term perspective, you may refer to our Ethereum price analysis.