Our Ethereum price prediction has just flipped bullish due to the massive breakout during the weekend. The positive price action continued even during the weekdays as the ETH price soared to $1631 on Tuesday. However, the market started to correct on Wednesday as the news of Tesla selling its 75% of Bitcoin holdings hit the market.
Ethereum is now leading the market as most money flows into the top smart contract platform. The daily trading volume of ETH even surpassed that of BTC on some exchanges as the coin broke out of the ascending triangle pattern on 4H timeframe. At the time of writing, the Ethereum price is trading at $1,504.
According to official Ethereum news, the foundation member Tim Beiko has mentioned the 19th of September as the provisional date for Ethereum 2.0 merge. Many investors reloaded their ETH bags after this news, anticipating a bullish price action leading up to the much-awaited event. Nevertheless, it is worth mentioning here that the update is highly likely to get delayed once again. This is considering the history of the platform.
Ethereum Price Prediction
Technical analysis of the ETH USD chart depicts a clear breakout of the ascending wedge pattern since its bottom at $881. The measured target of this breakout is $1,666, which also perfectly aligns with the 0.786 Fib retracement level.
Nevertheless, the price has failed to hold the 0.618 Fib level and now trading significantly below that level. These fib levels come into play by connecting the local peak of $1,874 to the June low of $881. As per our Ethereum price prediction, the ongoing pullback might continue till $1403.
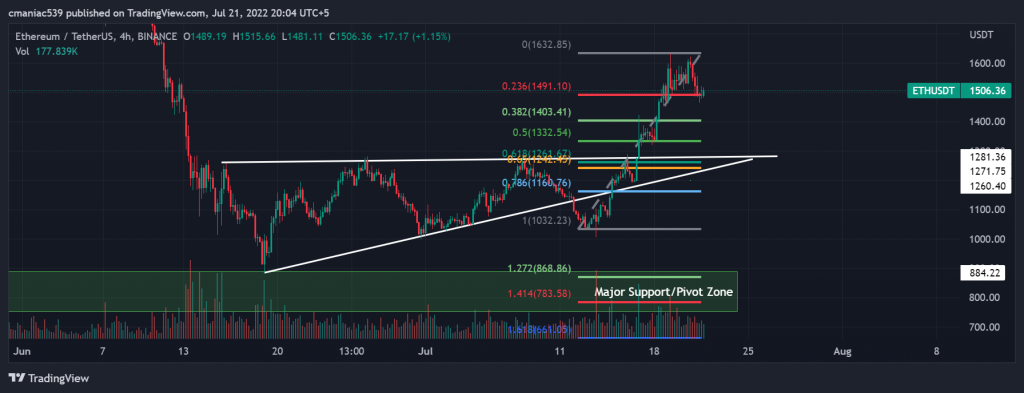
If this level fails to hold, the next potential pivot could be $1,261. Both levels are 0.382 and 0.618 Fib zones of the ongoing retracement from $1,631. Therefore, if you’re planning to jump on the ship, then these two zones might act as good entries. To manage your risk better, it is advisable to cut the losses in case of a daily closure below $1,261.
ETH USD 4H Chart