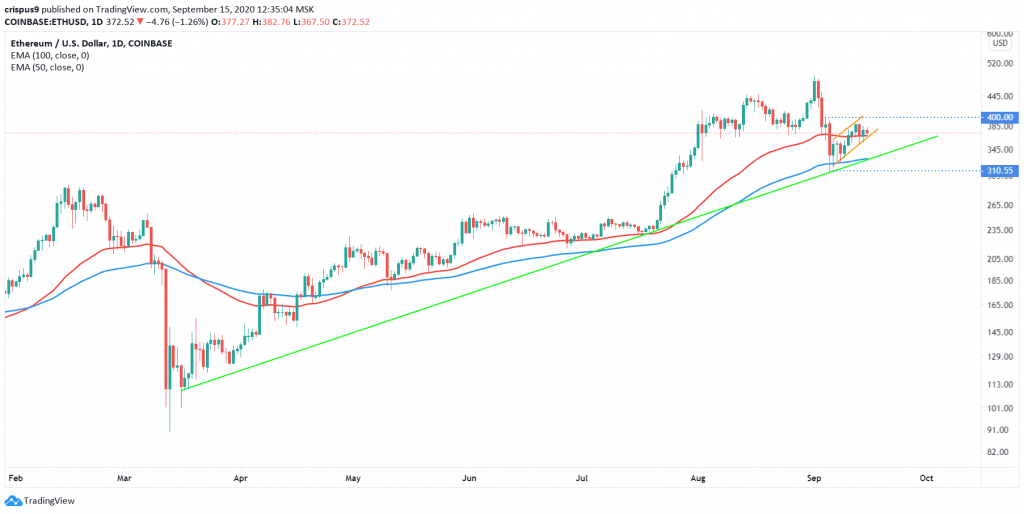
- Ethereum price has formed a bearish flag pattern. This sends a warning that a pullback may happen in the near term. If it does the price may fall below $300
Ethereum price (ETHUSD) is down by more than 2% today, partly erasing some of the gains that were made yesterday. The currency is still up by more than 1.5% in the past 24 hours. Similarly, bitcoin, tether, and ripple prices are up by more than 1% in the past 24 hours.
Ethereum price is struggling even after data shows that more people are using Ethereum gas. For starters, gas refers to the cost that users have to pay to conduct a transaction in the Ethereum blockchain. This gas is usually validated by miners who need to accept a transaction. According to Glassnode, the total number of Ethereum gas has been on an upward trend. In fact, on September 6, more than 80 billion units of gas were used.
This is happening mostly because of the growing Decentralized Finance (DeFi) industry. For starters, this is an industry that develops payment platforms on several blockchains. Ethereum is the leading platform that is used to develop these apps. Indeed, it is used in 40 of the 41 biggest DeFi platforms like Aave, Maker, and Curve Finance.
The DeFi industry has been growing rapidly. According to data compiled by DeFi Pulse, the total value locked in DeFi has grown to more than $8.5 billion from less than a billion in January this year.
Ethereum price is under pressure even as the US dollar continues to decline. The dollar index is down by more than 0.20% today as traders wait for the upcoming FOMC decision. The bank is expected to leave interest rates unchanged and hint at more support for the economy.
Ethereum price technical outlook
Ethereum price fell to a low of $310 last week. A look at the daily chart shows that the price did not fall to this price by mistake. Indeed, this price is along the ascending trendline that connected the lowest level on March 18 and in July. And since the decline, the price has been rising and is now trading at $370. The price is also forming a bearish flag pattern that is shown in orange. The price has also moved above the 50-day moving average.
Therefore, because of the flag pattern, I suspect that ETHUSD will resume the downward trend and possibly move below the ascending trendline. On the other hand, a move above $400 will mean that there are more buyers in the market, which will push the price higher.
Start your trading journey with our free forex trading course and one-on-one coaching by traders and analysts with decades of experience in the industry.
ETHUSD technical chart


