The Dow Jones remarkable bull run has hit a wall even as the fear and greed index rises. The index is trading at $35,443, which is a few points below its all-time high. The same trend has happened in the S&P 500 and Nasdaq 100 indices that are trading at record highs.
Explaining the Dow Jones performance
The Dow Jones has had a spectacular rally in the past few months. The index has risen by more than 20% in the past 12 months and 17.5% year-to-date.
There are several catalysts to this performance. First, Congress has passed a multi-trillion spending package since the pandemic started. Precisely, it has passed more than $5 trillion and is on track to pass another $1 trillion infrastructure package. These funds have flowed into stocks and pushed their prices substantially higher.
Second, the Federal Reserve has left interest rates low and is printing $120 billion every month through its open-ended quantitative easing program. All this liquidity has led to all types of inflation, including that of stocks. Indeed, the S&P 500 PE ratio has jumped to more than 40 and is close to levels not seen since the Dot com bubble.
Third, the Dow Jones index has jumped because of the strong earnings by American companies. In the second-quarter results, most companies in the index released better results and boosted their forward guidance.
Meanwhile, investors are getting greedy. The fear and greed index has moved back to the greed zone and is currently at 56. The yield spread of junk bonds and investment-grade bonds has fallen while safe haven demand has eased. Later today, the DJIA will react to the latest American non-farm payrolls data.
Dow Jones forecast
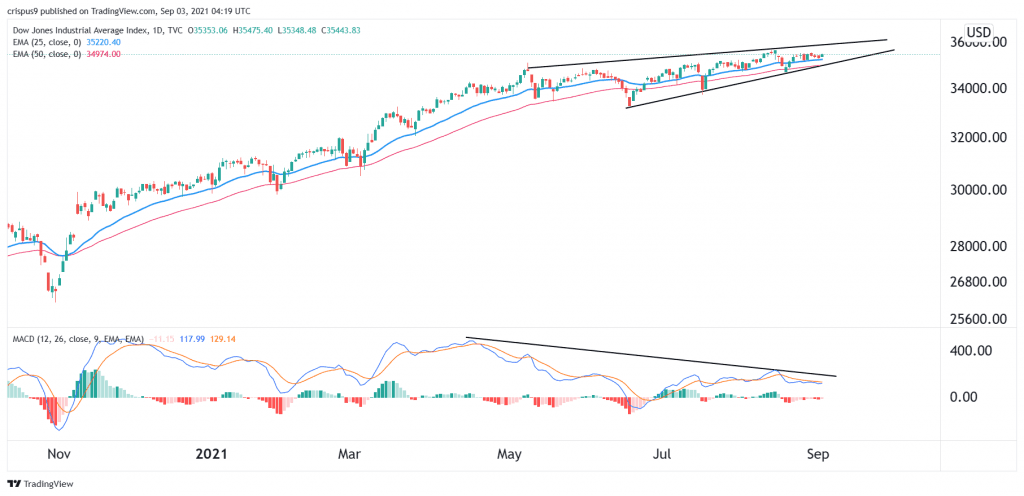
The daily chart shows that the Dow Jones strong recovery has hit a wall. Recently, the upward trend has faded. At the same time, it has formed what looks like a rising wedge pattern. In price action, a rising wedge is usually a bearish sign.
At the same time, the MACD has formed a bearish divergence pattern. Therefore, there is a likelihood that the index moment of reckoning will happen soon since the wedge is nearing its confluence zone. If this happens, the next key support to watch will be $33,800. On the flip side, a move above $35,370 will invalidate this view.