The Dow Jones Index (INDEXDJX: .DJI) is showing negative price action after rising in January. Despite a strong bounce from the 2022 lows, the Dow Jones average has failed to claim any key level. Many analysts are still calling this significant rebound a dead-cat bounce.
Since making a double bottom pattern in October, DOW has surged by 15.5%. This also relates to a corresponding bounce in S&P 500 index, which also showed positive price action in January.
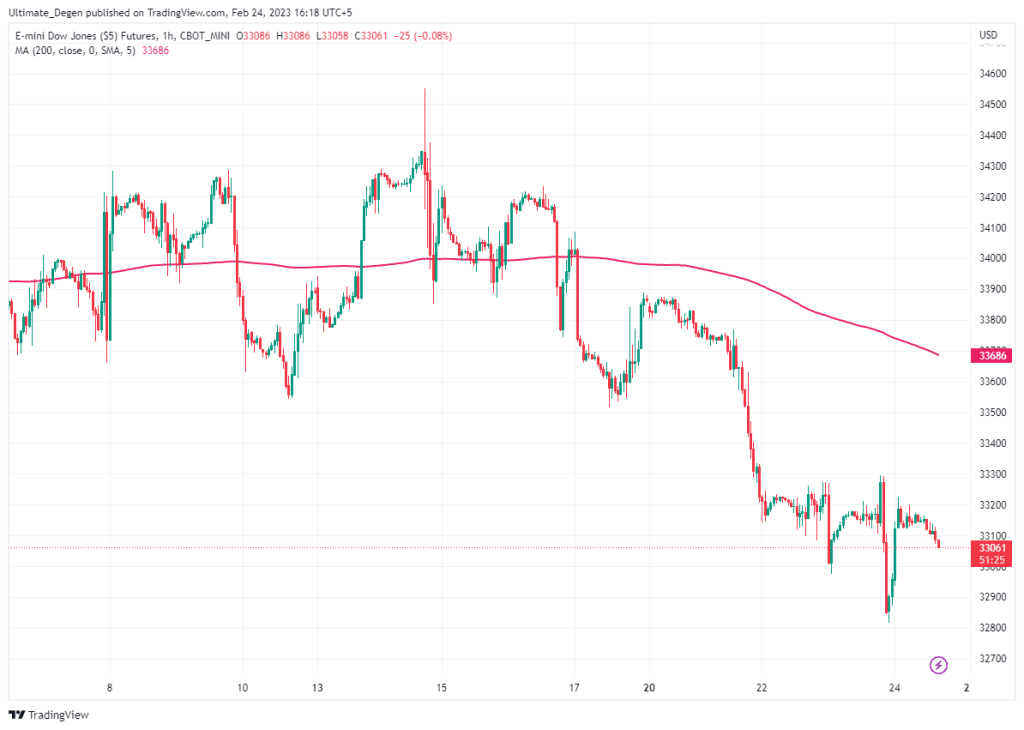
Dow Futures Price Continue To Slide
Dow futures now trade at 33067, which is just a few points shy of the month’s low of 32816. On Friday, Dow Jones futures opened at 33139 and slid to 33068 during the European session. Till press time, the price is down 0.36% since yesterday.
In the coming weeks, the equities are likely to remain in a downtrend as analysts are expecting multiple rate hikes to come. Goldman Sachs analysts are of the opinion that there can be at least 3 24 basis points hike lined up till June 2023. This will give Dollar a lot of strength as the DXY has already bounced off its yearly lows. This will make Dow Jones Index to tumble in the near term.
DXY index has gained 3.6% since its February 2023 bottom of 100.82. As the Fed turns more hawkish in its efforts to speed up the inflation decline, USD is expected to gain more strength.
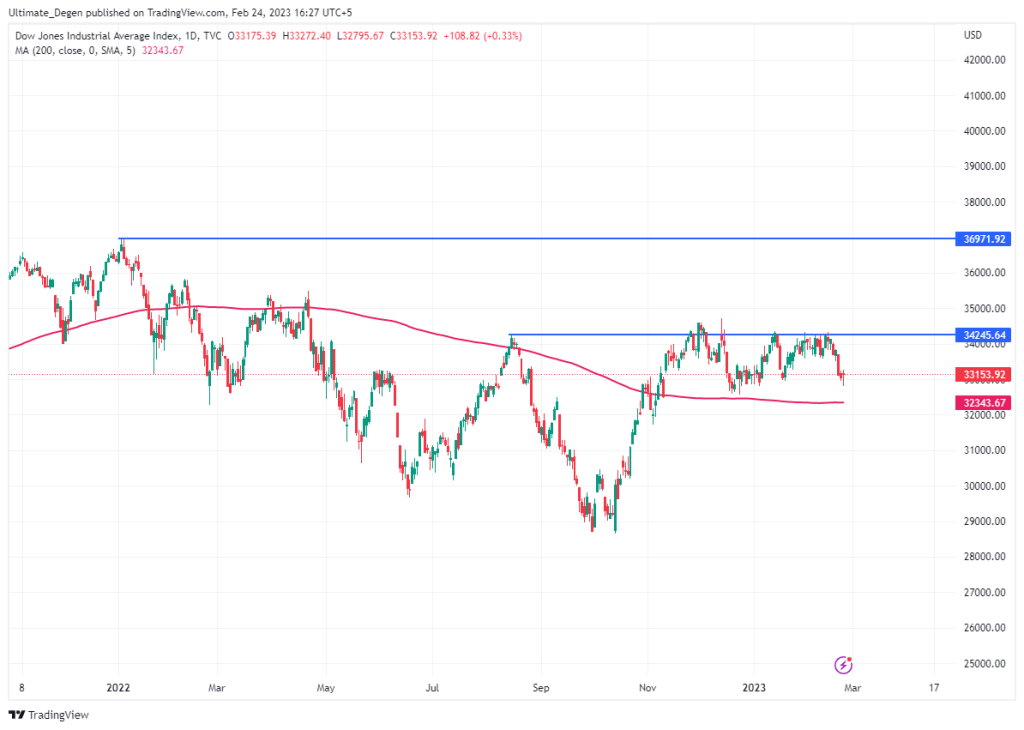
Dow Jones Index Chart & Forecast
On 1D timeframe, the Dow Jones chart has been showing a sideways price action since December. The index has attempted several times to break above the August 2022 high of 34280 but the price got rejected every time. The most recent attempt was made in February, but the hawkish Fed comments triggered another retrace.
The only thing in the favor of the bulls is the fact that the price is still trading above 200 MA on daily chart. This indicator can act as a line in the sand in the coming days as the price is heading for a retest. A breakdown below 200-day MA can give bears enough momentum to target last-year lows.