

- Bitcoin opens 2026 near $89,300 as on-chain indicators suggest the market has already entered a bear phase
- CryptoQuant data points to weakening long-term momentum, with historical models indicating a possible $56,000–$60,000 floor
- Despite bearish signals, structural stability and strong holder behaviour suggest any downside is likely to be gradual rather than a capitulation
Bitcoin is starting 2026 under growing scrutiny, with on-chain indicators suggesting the market may already be several months into a bear phase despite prices holding well above prior cycle lows. As traders return from the holiday break, long-term metrics tracked by CryptoQuant point to weakening momentum that first emerged in early November and has yet to recover, raising questions about whether the new year begins with distribution rather than expansion.
While bitcoin remains far from capitulation territory, analysts say the lack of follow-through since late 2025 signals a structural shift. The focus as 2026 begins is no longer on chasing highs, but on identifying where a durable floor could form if bearish conditions persist.
Bitcoin On-Chain Indicators Signal Bear Market at the Start of 2026
One of the key tools behind that assessment is CryptoQuant’s Bull Score Index, a composite indicator that tracks network activity, investor profitability, liquidity conditions, and buying pressure. While the index ranges from zero to 100, sustained readings at lower levels have historically coincided with extended downtrends rather than brief corrections. Most of its underlying components have remained weak since late 2024, reinforcing the view that the current phase reflects structural cooling rather than short-term volatility.
Another confirming signal is Bitcoin’s one-year moving average. When price trades persistently below this level, it has historically marked extended bear phases. Bitcoin began 2025 near $93,000, peaked at $126,080 in October, and closed the year below its opening level. As 2026 opens, bitcoin trades near $88,500, reinforcing the view that momentum weakened into year-end.
Why Analysts See a $56,000–$60,000 Bitcoin Bottom as Plausible
Moreno argues that historical cycles offer a useful framework for assessing downside risk. In prior bear markets, Bitcoin has tended to gravitate toward its realised price, the average price at which all existing coins last moved on-chain. Based on long-term data, CryptoQuant estimates that realised price dynamics could place a potential floor in the $56,000–$60,000 range during 2026. This would represent a drawdown of roughly 55% from the cycle high, significantly milder than the 70–80% collapses seen in earlier crypto bear markets.
The relative moderation of the current downturn reflects structural changes in the market. Institutional participation is deeper, exchange balance sheets are stronger, and long-term holders control a larger share of supply. Unlike 2022, the market has not experienced cascading failures or systemic shocks.
As a result, analysts believe any further decline is more likely to be gradual and orderly rather than panic-driven, even if short-term indicators continue to flash caution.

Bitcoin Chart Analysis: Early 2026 Structure Signals Caution, Not Capitulation
Bitcoin is trading around the mid-$88,000 area as 2026 begins, with the daily chart showing a clear loss of upside momentum following the October peak.
- Immediate resistance: $90,000–$92,000, where prior rallies have stalled
- Key support: $87,000–$88,000, currently acting as a short-term floor
- Broader downside zone: $80,000–$82,000, where stronger demand previously emerged
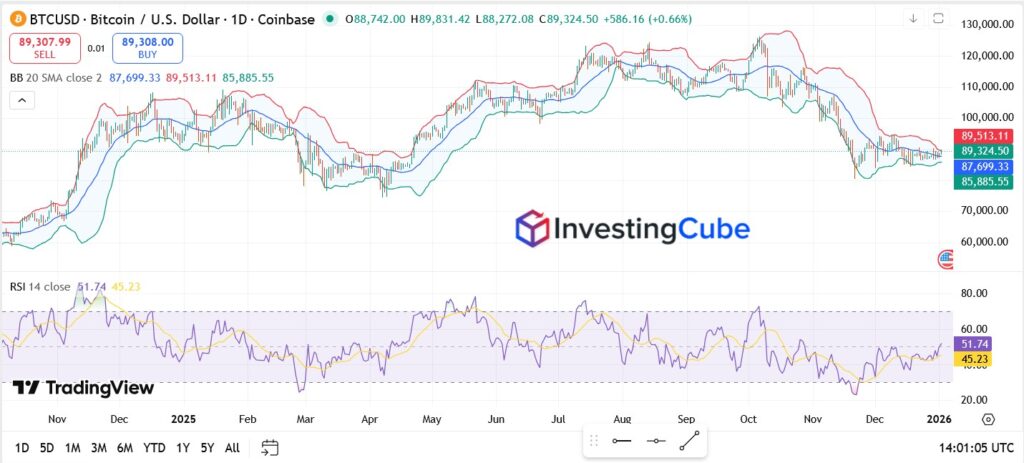
A sustained daily close back above the $92,000 region would be needed to restore bullish confidence. Conversely, a clean break below $87,000 would increase the probability of a deeper corrective phase.
Bitcoin Outlook For Early 2026
Bitcoin enters 2026 in a range-driven market rather than a momentum trend. With price holding above near-term support but failing to reclaim key long-term averages, the bias remains neutral-to-bearish. Unless bitcoin decisively breaks back above resistance in the low-$90,000s, rallies are likely to face selling pressure, while downside is expected to unfold gradually rather than through capitulation. The next sustained move will depend on whether demand strengthens enough to absorb supply as volatility rebuilds later in the quarter.
Bitcoin is showing early bear-market characteristics based on long-term on-chain metrics, though price action remains stable and has not entered capitulation.
The most important zone is the long-term support area around the mid-$80,000s. Holding above it supports stability, while a breakdown would increase downside risk.
A recovery is possible if long-term demand strengthens and Bitcoin reclaims key resistance levels, but confirmation will require improved momentum and participation.