

- The advance of copper price has stalled on the day with the formation of a dark cloud cover pattern, but the bullish momentum on the red metal persists.
Copper price is trading lower today but still trades at two-year highs. Today’s pause has not ended bullish speculation on the red metal, as Research Analysts at Commerzbank believe that copper price still has some bullish momentum left in its wings.
There is meat to the Commerzbank projections for copper price. Latest data from China indicate that recovery of the Chinese economy is driving copper demand, with the delivery of copper futures for December 2020 reaching $3.065 per pound on COMEX. China’s non-manufacturing PMI data for August show a robust recovery from 54.2 to 55.2, even as manufacturing PMI remained static. But stimulus packages from the Peoples Bank of China have placed industrial output and demand back to pre-coronavirus levels, fuelling robust commodity buying. I also noted in the last coverage of copper price that inventory shortfalls and lack of sufficient output were helping to push copper price.
Technical Outlook for Copper Price
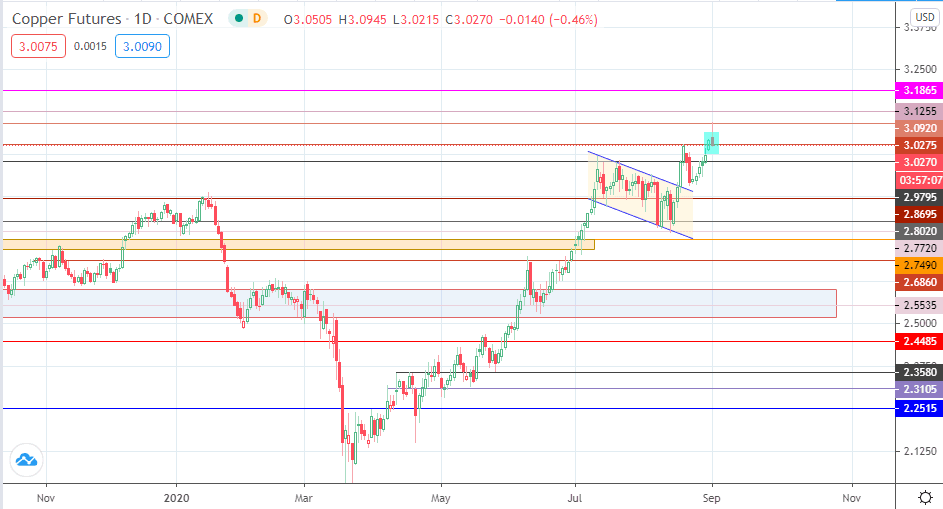
The latest advance in copper price has taken it clear of the 3.0275 resistance as it trades at 2-year highs. However, this move has been put in doubt by today’s candle, which has formed a dark cloud cover when combined with Monday’s price action candle. This candle formation has put the ascent towards 3.1255 in doubt, as the 3.0920 resistance held firm. If this candle formation ends up truncating the bullish copper price activity, 2.9795 becomes the next logical target. Below this level, 2.8695 and 2.8020 make up additional support targets. Further descent will depend on whether copper price has the momentum to break down the 2.7490 support wall’s ceiling, which would bring in 2.6860 and 2.5535 into the picture as additional targets.
Conversely, only a break above the 3.0920 resistance would establish the higher highs needed to continue the ascent towards 3.1255. Additional resistance is located at 3.1865. As it is, the dark cloud cover candlestick pattern will have to resolve one way or the other, and accompanying price action on the daily chart for the rest of the week will make things more straightforward.

Copper Price Chart (daily)