

- The 15-minute chart shows sellers regaining control, while the 4-hour chart suggests that this weakness is occurring within a broader downtrend. Unless gold can reclaim $4,312, the overall bias remains tilted to the downside.
Today’s gold technical outlook will focus on two time frames to provide a closer look at recent price action. We will begin with the 15-minute chart to assess short-term market movements, then shift to the 4-hour chart to evaluate the broader trend.
Gold remains capped below the key resistance level at $4,300, which also aligns with the longer-term moving average. Although prices edged higher during the previous session, the advance lost momentum and was followed by a pullback as rising hawkish Fed expectations continued to weigh on sentiment.
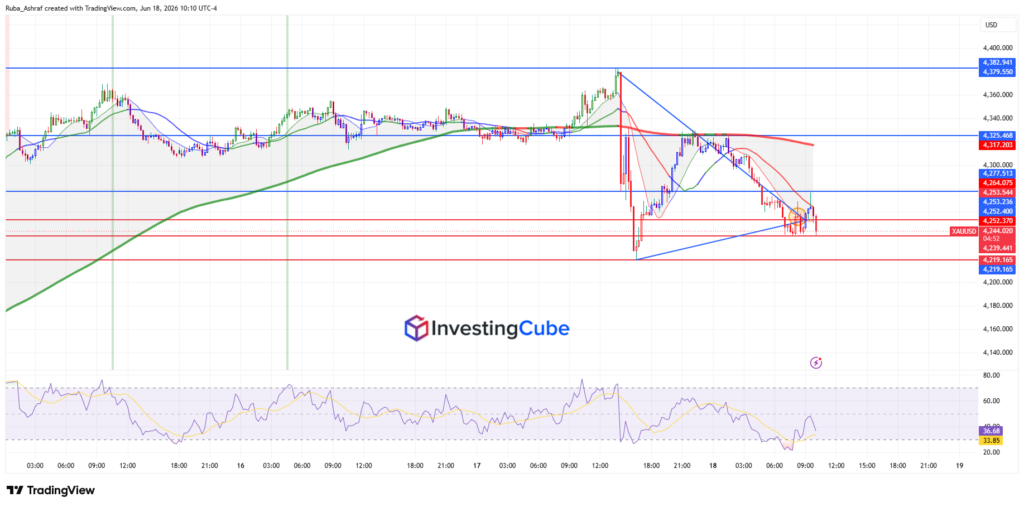
On the 15-minute chart, gold remains under clear short-term bearish pressure after failing to sustain its recovery from the sharp sell-off seen earlier in the session. The market attempted to rebound from the $4,219–$4,239 support zone, but the recovery stalled beneath the key resistance area around $4,252–$4,264, which is highlighted by the orange circle.
This area acted as a rejection point where buyers lost momentum, and sellers regained control. This leads to another downside move. The sequence of lower highs formed after the initial rebound suggests that bearish sentiment remains dominant in the near term.
The inability of buyers to hold above the trendline is an early warning that the downside pressure is strengthening. The moving averages reinforce this view. The shorter-term moving averages have rolled over and are now acting as dynamic resistance. The price is trading below the longer moving averages. More importantly, the market remains well below the major resistance zone around $4,325, which aligns with the longer-term moving average.

The RSI recently attempted to recover from oversold territory but failed, then turned lower again. This indicates that buying momentum remains fragile and that sellers continue to dominate the short-term direction. While the RSI is not deeply oversold yet, it suggests that bullish conviction is still lacking.
Potential Bearish Scenario for Gold Price:
The bearish outlook remains favored as long as gold trades below $4,252–$4,264. A sustained move below the immediate support around $4,239 could expose the next support at $4,219. If this level fails to hold, sellers may target deeper downside extensions toward the next major support zones. The break of the ascending trendline supports this scenario and increases the probability of further weakness.
Potential Bullish Scenario for Gold Price:
For buyers to regain control, gold would need to reclaim the $4,252–$4,264 resistance zone and establish acceptance above it. Such a move would invalidate the recent breakdown and could trigger a recovery toward $4,277, followed by the more significant resistance area near $4,325. However, given the current moving-average alignment and weakening momentum signals, bulls would need a strong catalyst to shift the short-term trend back in their favor.
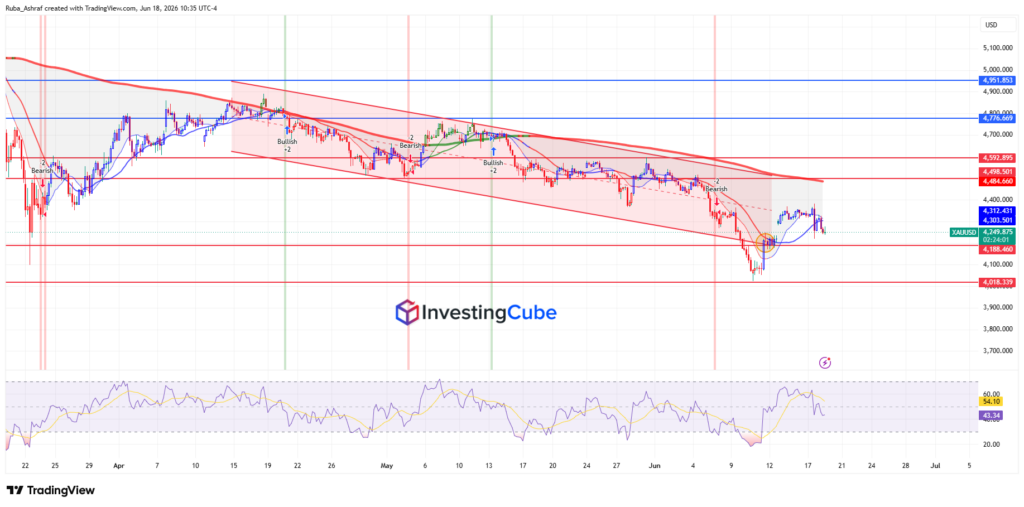
The 4-hour chart provides the broader context behind the weakness seen on the 15-minute timeframe. While the lower timeframe shows a recent trendline breakdown and renewed selling pressure, the 4-hour chart reveals that gold remains within a larger bearish structure marked by a descending channel and a series of lower highs and lower lows.
The RSI has recovered from oversold levels but is now turning lower near the midpoint, suggesting that bullish momentum is fading. This aligns with the weakness currently developing on the 15-minute chart.
In the near term, $4,303–$4,312 remains the key resistance zone. A break above this area could extend the recovery toward $4,485, while failure to do so would keep the broader bearish trend intact and leave gold vulnerable to another move toward $4,188 and potentially lower levels.