Today’s trading session has seen Cardano wipe out gains made by yesterday’s bullish move, setting a session low of $1.00.
Latest Cardano Price News
The fight between Cardstarter and SundaeSwap has partly fueled today’s drop in price. The two companies have been feuding over their marketing agreements and are accusing each other of breaking these commitments. Cardano has been drawn into the fight because the two platforms are built on the Cardano blockchain.
The Feuding has gone so far, prompting Cardano founder Charles Hoskinson to take to YouTube and urge the two concerned companies to come into an understanding. Complaints about the two platforms have also put Cardano on the spot and possibly contributed to today’s drop in prices.
Cardano Price Prediction
Cardano opened today’s trading session at $1.07, reaching highs of $1.08, before dropping to wipe away gains made by the crypto yesterday.
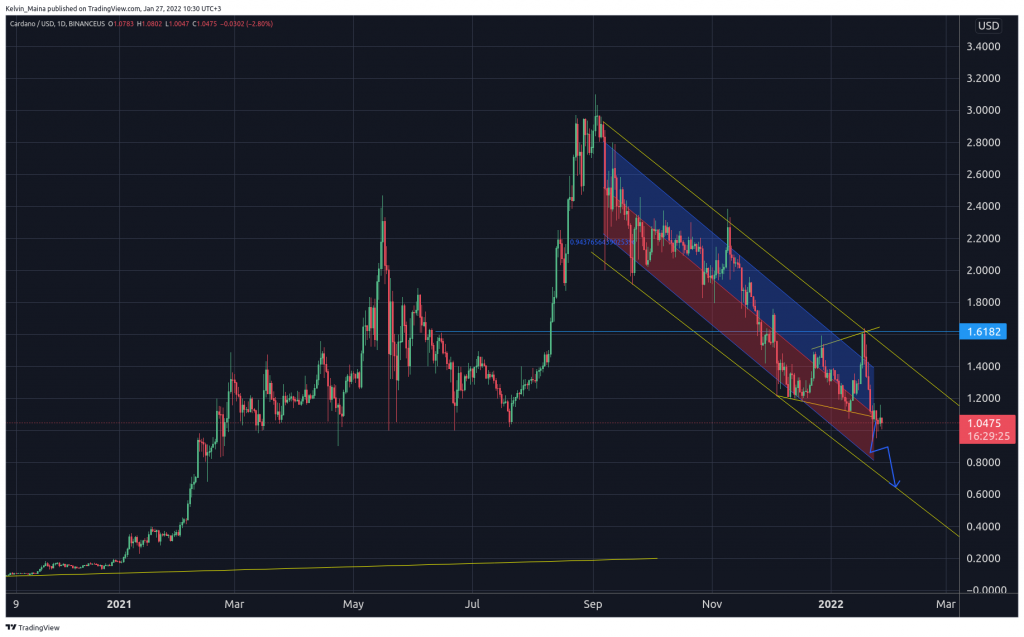
On the daily chart, Cardano has been in a long-term bearish move since September 6th, trading within a descending channel and a regression trend channel.
The daily chart shows that Cardano’s price action between September 6th and now has resulted in the upper trendline being tested on four different days without a breakout. The lower trendline has also been tested on three different days.
Currently, the prices have been trading sideways for the past six days. This is after hitting the channel’s upper trendline, which resulted in an impulsive bearish move.
Based on the current and historical price action analysis, I expect the next impulsive move to be to the downside. I expect that the prices will move towards the lower trendline of the regression trendline at $0.60. If the impulsive move is strong enough, there is a possibility that prices will break out of the channel and hit the lower long-term descending channel.
However, suppose the prices continue to trade sideways, and prices move to the regression trend channel’s blue area of $1.20 to $1.40. In that case, my trade analysis will be invalid, and a possible reversal to the upside may be in the offing.
Cardano Chart