



Archived Article This article was published more than 5 months ago. The market data, prices, forecasts, and analysis were accurate at the time of publication but may have changed since then. Please use this article for historical reference only and refer to our latest content for current market information.
- The Cardano price jumped to $2.400 on Tuesday before sliding 7.50% on Wednesday, following Bitcoin's sharp reversal
The Cardano price jumped to $2.400 on Tuesday before sliding 7.50% on Wednesday, following Bitcoin’s sharp reversal. This morning, Cardano (ADA) is unchanged at $2.079, as the market takes stock of the recent price action.
Although Cardano has underperformed, the price is up around 5.60% so far in October. However, Solana (SOL) has overtaken Cardano, leaving ADA the 6th-largest cryptocurrency ahead of Ripple (XRP). Furthermore, ADA’s lack of progress comes as the combined value of the crypto market is worth around $2.85 trillion, just short of last week’s record $3 Trillion peak.

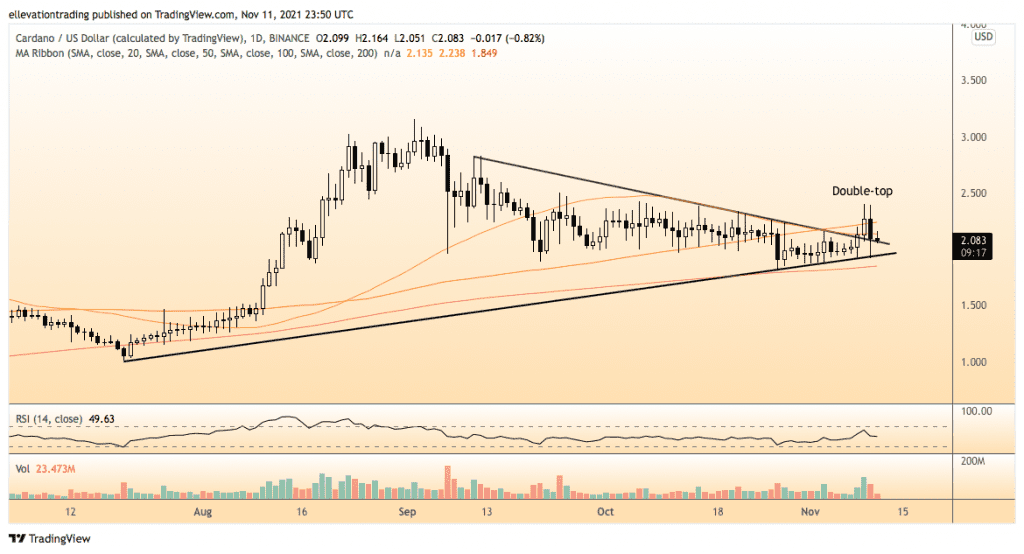
The ADA token started this week firmly in bull mode, breaking above a descending trend-line and clearing several resistance levels. However, the rally faltered when Bitcoin suddenly dropped 9% from its $69k all-time high. As a result, Cardano slipped 20% from its intraday high before bouncing from $1.920 and closing the day back above the trend support. Subsequently, ADA has got a fight on its hands to maintain the breakout, which could be pivotal for the price.
ADA Price Analysis
Cardano is currently trading above the trend support at $2.040 but below the 50-Day Moving Average (DMA) at $21.30 and the 100 at $2.245. Successful clearance of the 100-DMA should lead to an extension towards the September all-time high of $3.160.
The biggest threat for the bulls is if Cardano loses trend support. In that event, a rising trend-line at $1.930 and the 200-DMA at $1.853 are critical support levels. I would consider a close below the 200-DMA as extremely bearish, potentially forcing liquidation and a trip towards $1.5000. At the same time, a steeper sell-off would target the July lows around $1.000.
Cardano Price Chart (Daily)
For more market insights, follow Elliott on Twitter.