

- The USDCAD is in focus as the Canadian GDP figure for October is released, with analysts expecting the Canada GDP to remain static at 0.1%.
At 1.30pm GMT, the Canadian GDP data (monthly) will be released to the markets and may have some effect on the USDCAD if the deviations parameters are met. Published by Statistics Canada, the data will reflect the Canadian GDP figure for October 2019. The market’s consensus estimates are for the figures to have remained static at 0.1%; unchanged from the previous reading.
However, the GDP figure at industry level are expected to contract by 0.1% as a result of contractions in utility output and unusually warm weather patterns for the season. This is expected to show up as a drag in the manufacturing sector. However, the services sector is expected to fare slightly better as a result of greater output from professional services.
Read our Best Trading Ideas for 2020.
How Can You Trade the USDCAD Using the Canadian GDP Data?
We need to see a deviation of 0.1% on either side to make the Canadian GDP data tradable. In other words, if the GDP data comes out at 0.2% or higher, then this is CAD-positive and the USDCAD could experience some selling.
If the Canadian GDP figure comes in at 0.0% or more negative, this is a CAD=negative scenario and we could see some USDCAD buying. The greater the deviation, the greater the market impact seen on the charts.

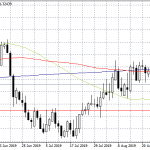
The technical patterns shown on Friday remain unchanged at the moment, with the USDCAD starting to challenge the upper border of the falling wedge on the daily chart at the 1.31512 price level.
A break of this level to the upside could be triggered by a downbeat Canadian GDP figure; this break must be confirmed by two successive daily candle closes above 1.31512. This breakout would then target the 1.3203 price level (immediate upside target), where the previous high of October 30 as well as several clusters of lows seen on Aug 9-12, Sep 5 and Nov 19-20 are located. Above this level, the price area that extends from 1.3297 to 1.3348 comes into play as the next upside target. This area would have to be broken by strong bullish action to target 1.3432 and 1.3523.
On the flip side, failure of the wedge break due to upbeat Canadian GDP data could send price back to the wedge’s lower border at 1.3063 (lows of Feb 1 and Oct 29). Below this area, 1.3027 throws itself up as a further downside target, situated where the previous lows in July 2019 are found.