- Curious about how Bitcoin will perform as July winds down? Here are some ideas as to the current support and resistance levels on BTCUSD.
BTCUSD has had an eventful week but a very quiet day, as it has more or less settled at the $10,330 price level. What should traders of BTCUSD and even those who trade various altcoins combinations with BTC expect as we head into the home stretch for July?
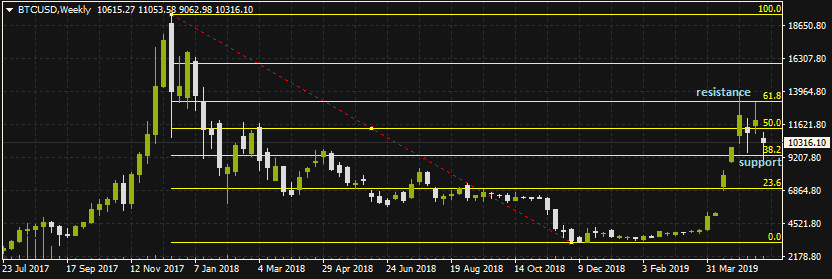
This view is on a weekly chart; a medum-term view. A Fibonacci trace from the December 2017 all-time swing high to the December 2018 low reveals that the price action has basically hovered between the 38.2% Fibonacci level as support ($9,600) and the 61.8% Fibonacci level as resistance ($13, 164) for most of July. The Fibo levels are better visualized on the daily chart, where they can serve as the basis for short term plays. These Fibonacci levels may continue to dominate price action for some time to come.
To the upside, we look to see if BTCUSD will breach the 50% Fibonacci level at $11.340. If this level is overcome, then price will start to aim for the 61.8% Fibo level of $13.164.
On the flip side, a downside violation of the $9,468 price level, which is the 23.6% Fibonacci price area, will see the gates opened to a test of the support level seen below at $6.900, even though there will be intervening pit stops along the way.

This is a medium term view of BTCUSD. Direction has to be sought from the news.Don’t miss a beat! Follow us on Twitter.
Download our latest quarterly market outlook for our longer-term trade ideas.