

- The Bitcoin price lost ground in September and ended the month down 6.6% at $44,100. However, BTC hit the ground running in October
- Bitcoin Surges 57% to a new record
- ProShares Bitcoin ETF makes spectular debut
- Are Bitcoin ‘Whales’ selling the rally?
- New high acheived: What happens next?
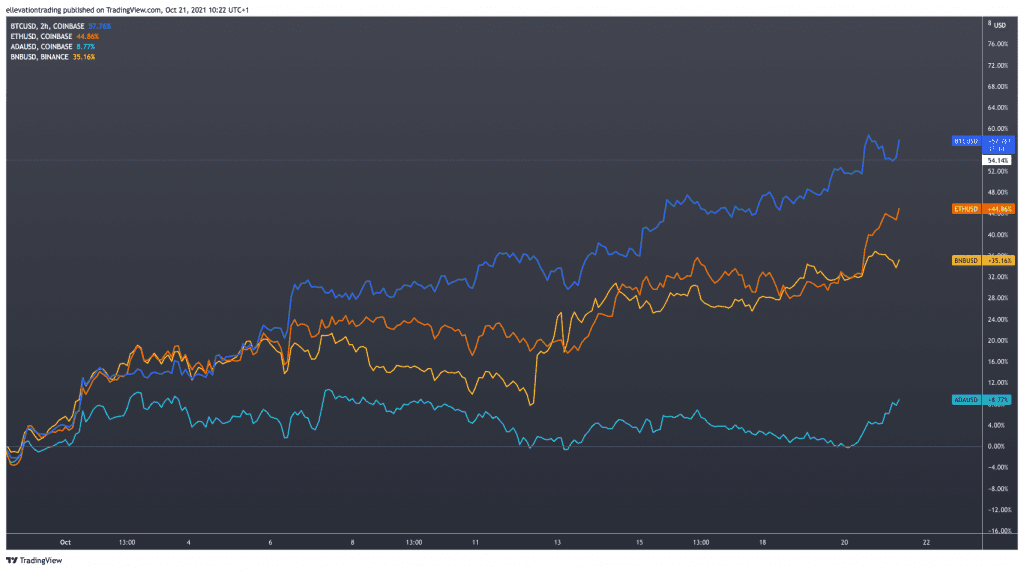
After a disappointing September, the Bitcoin price has roared back to life in October. BTC reached a record price of $66,999 on Tuesday the 20th, lifting its market cap to $1.26 Trillion. Bitcoin is outperforming rivals Ethereum (ETH), Binance Coin (BNB), and Cardano (ADA) so far this month and has increased its crypto market dominance to 47%.
Finally, a Bitcoin ETF
The approval of the ProShares Bitcoin ETF (BITO), which was listed on Tuesday, is undoubtedly the biggest driver of the recent rally. The Exchange Traded Fund is the first to be approved in the United States and attracted $1 billion of inflows in the first two days, making it the most successful ETF launch ever. However, the fund doesn’t hold ‘physical’ coins; instead, it exposes investors to Bitcoin futures. Because of the forward ‘contango’ curve and the negative roll effect, a futures-backed product is considered an expensive alternative to holding Bitcoin. Nonetheless, the fund’s impressive performance since its listing suggests a strong investor appetite. Furthermore, after a nine-years of lobbying the Securities and Exchange Commission to approve an ETF, the listing is a watershed moment. And as a result, we expect more regulated Bitcoin-backed products will be approved moving forward.
Bitcoin Price Performance
The Bitcoin price lost ground in September and ended the month down 6.6% at $44,100. However, BTC hit the ground running in October and erased September’s loss in under 24 hours. Bitcoin gained $4,300 (9.9%) on the first day of the month and never really took a back step until it reached $66,999. Subsequently, there are mixed signals whether the rally is sustainable at the current pace.
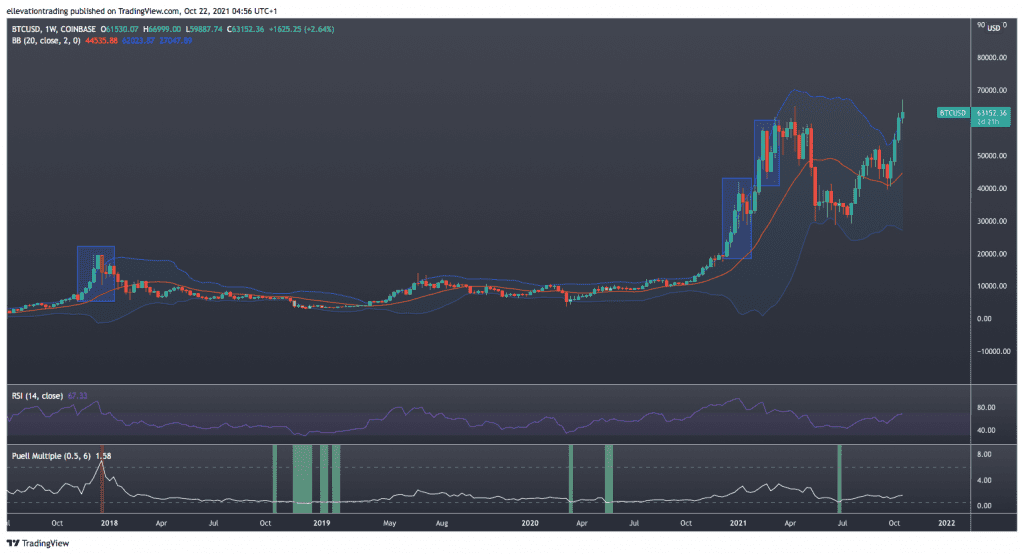
The weekly chart shows the Bitcoin price is on track to finish above the top Bollinger Band for the second week in a row, highlighting the parabolic nature of this month’s rally. However, the price remained above the top band for several weeks during previous parabolic phases.
The Relative Strength Index (RSI) reads 67.36 and is close to an overbought signal. Although again, historically, the weekly RSI has been a lot higher. During the bull run of 2017, the indicator reached 90.3 and, in January this year, peaked at 91.3 before a 30%, two-week correction.
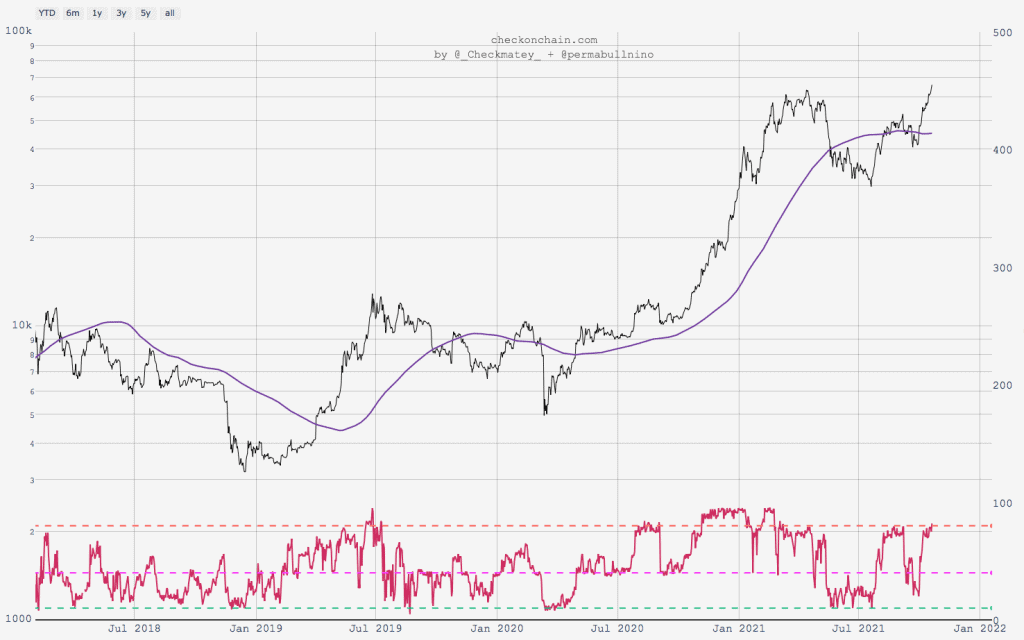
Notably, the Puell Multiple, which successfully called the top in 2017 and the $28,800 bottom in June, has turned higher, although the indicator shows no signs of an imminent trend change. Whilst our preferred technical indicators are elevated, they are not yet at levels that warrant concern. However, developments below the surface may indicate large holders are selling into the rally.
Large Holders Reduce Positions
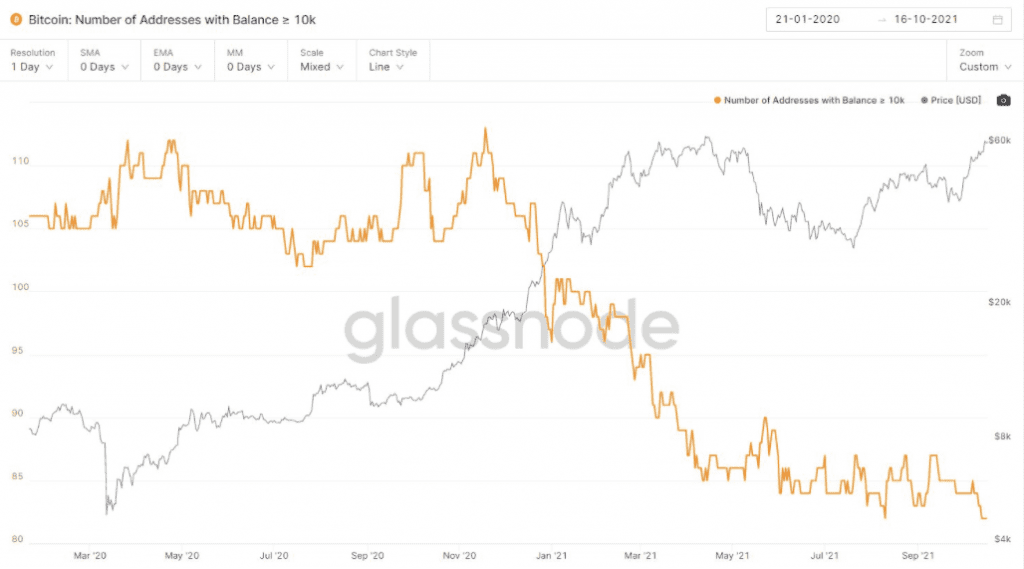
Data provided by Glassnode shows the number of wallets with balances above 1,000 BTC (whales) has dropped to a record low, which may indicate long term holders are liquidating their holdings. As the above chart shows, structural changes in whale holdings have been effective in predicting cycle tops and lows in the past. Whale holdings surged ahead of the rally in Q4 2020 but decreased dramatically before the sell-off in May. Furthermore, significant holdings increased during the trough in May through June, before the Bitcoin price increased 80% to $53,000 in September. Therefore, the recent drop could signify that prominent players consider the current price of BTC too high and expect a cheaper entry point in the future.
Bitcoin Flows into Exchanges
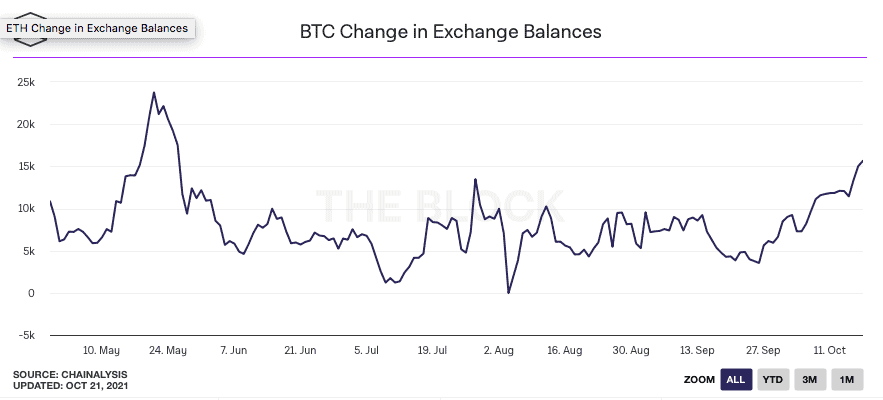
Similar to whale holdings, exchange flows provide valuable insight into investor sentiment. Chainalysis data shows the number of Bitcoins sitting on exchanges has reached a five-month high of over 15,000. Typically holders transfer Bitcoin from wallets to exchanges when preparing to sell their coins. Notably, the last time exchanges held this much BTC was in May, ahead of the 50% drawdown from $60k to $30k. Therefore, rising exchange balances may be significant.
Bullish Traders Gain confidence
Whilst the reduction in whale holdings and increasing exchange balances may indicate that some believe the Bitcoin price is too high, sentiment is very optimistic overall. The Bitcoin ‘Fear and Greed’ index reached 84 on Wednesday the 20th, indicating ‘Extreme Greed’. Although the indicator is high, the above chart shows the price typically does well when investors are greedy. However, investors often become overconfident at the top and over fearful at the bottom which can signal a reversal. Another way to gauge extreme sentiment is to see how much leverage traders are currently using.
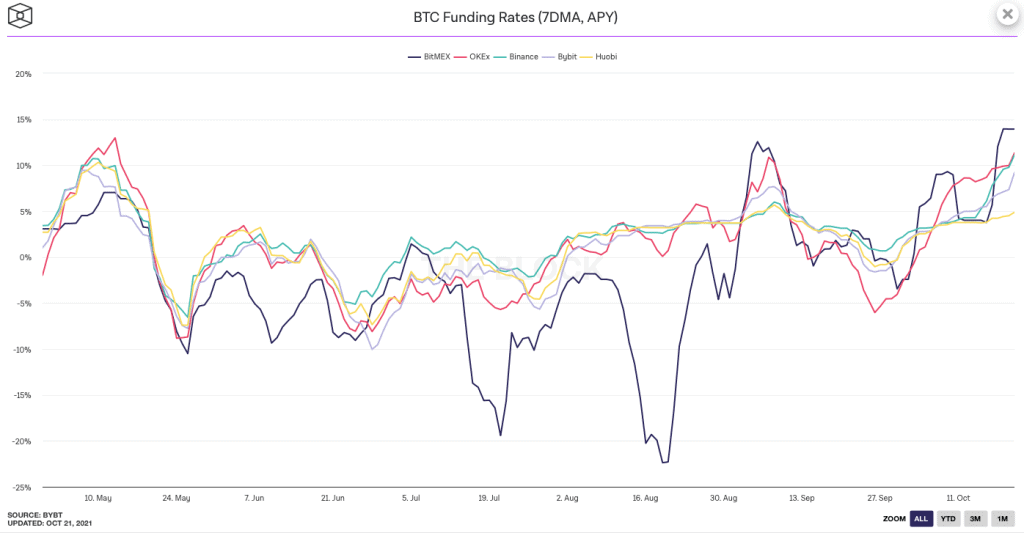
The funding rate for perpetual swaps across several exchanges suggests traders are more bullish now than in May. However, high funding rates imply traders are increasing their exposure to leveraged derivatives. If the Bitcoin price turns lower, the increased leverage could play a pivotal role. In volatile market conditions, leveraged positions are easily liquidated, which can lead to exaggerated price swings. In September, when funding costs rose sharply, similar to today, Bitcoin price declined by 26%. A slide of a similar magnitude from the current ATH would imply a decline to $50,000.
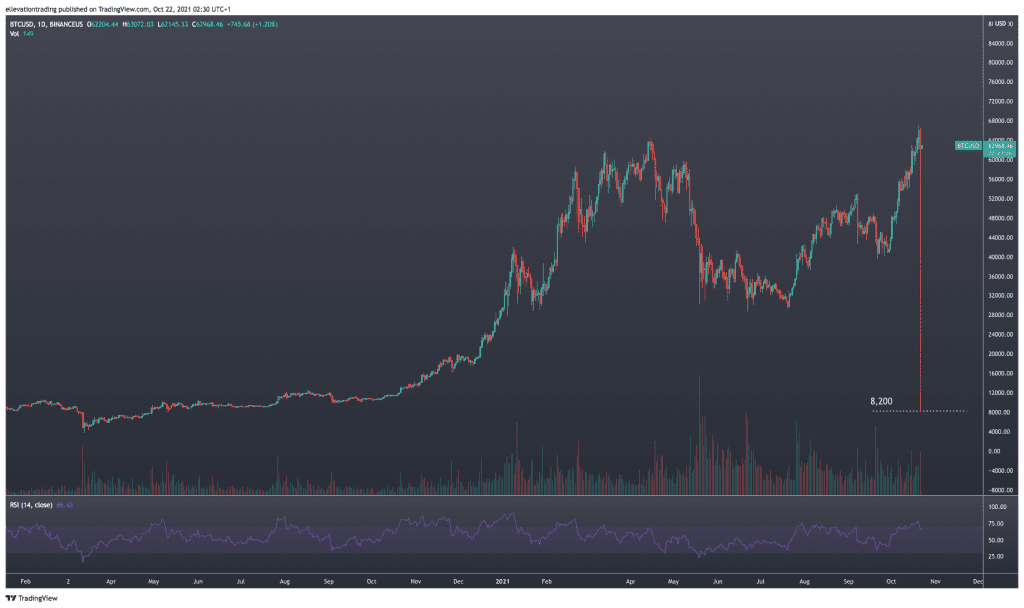
The danger of the recent price gain was evident late on Thursday the 20th when the Bitcoin price flash-crashed from $63,000 to $8,200 on the Binance US exchange. Whilst it’s unclear what caused the sell-off (likely an input error), the violent decline triggered stop-loss sell orders.
What happens to the BTC price now?
The bullish price action reflects the growing belief that similar to 2020, Bitcoin should have a strong Q4 and finish the year higher. Notably, October 2020 marked the start of a six-month 525% rally to the former all-time high of $64,899 in May. But it’s important to remember the starting point of that bull run was $10,800. Furthermore, because of Bitcoin’s current $1.27 trillion value, the amount of capital needed to shift the dial is vast.
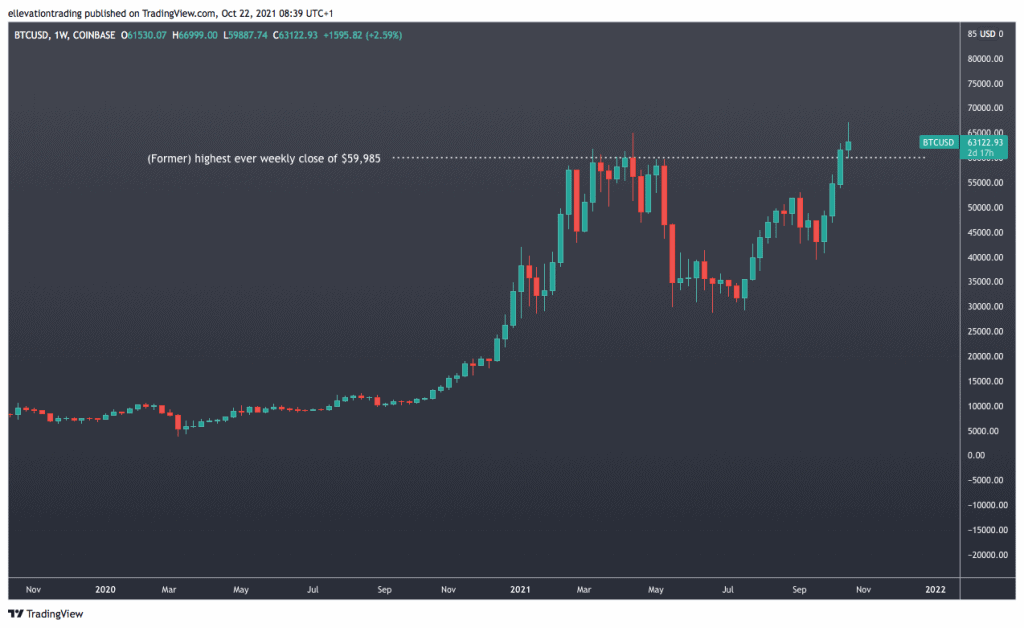
BTC is set to finish this week above the previous highest-ever weekly closing price of $59,995. As long as Bitcoin holds above $59,995, bullish traders will grow increasingly confident which may encourage buying and over-leverage. Furthermore, if BTC clears $66,999, the momentum could lift it into the $70,000-$75,000 range. In that event, the price will be further above the top Bollinger Band, with the RSI potentially showing an overbought reading. At that point, we would still be trading below the $100,000 target levels projected by the stock to flow models discussed in our September update.
These factors, combined with the rising exchange balances’ and whale activity suggest an extension higher may be short-lived. Therefore, gains may be limited in the near term as risk is passed from long-term holders to short-term traders.
Furthermore, the real danger for the bulls is if Bitcoin slides below $60,000. If that happens, it may be viewed as a failed breakout. Looking back over the last ten months reveals this would be a worrying sign.
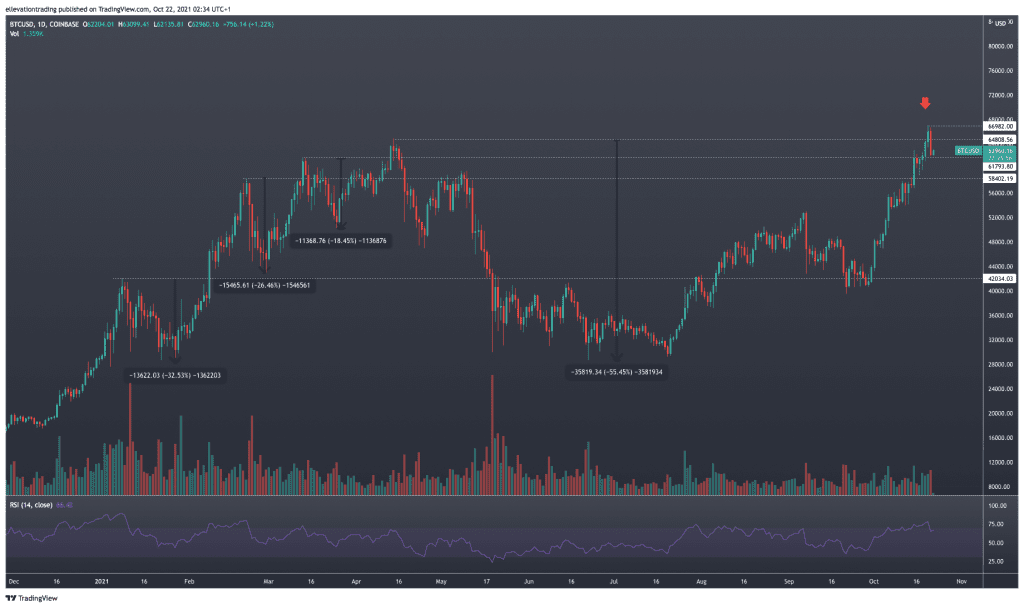
After setting a new high on the 20th, Bitcoin dropped $3,800 (-5.8%) the following day. As we have seen several times this year, if the Bitcoin price starts to retreat from an all-time high, the selling can quickly gather speed. Material declines followed new all-time highs in January, March (Twice) and April. And for that reason, the next few days could be crucial in deciding if Bitcoin will hold the gains.
Summary
Overall, the long-term prospects are intact. The introduction of a Bitcoin ETF is undoubtedly a step in the right direction towards greater adoption of Bitcoin as an asset class. Despite the current product’s lack of direct exposure to BTC, the SEC’s decision to allow it increases the odds of a physical-backed regulated product sometime in the future. Nonetheless, increasing signs of exuberance and growing supply may signal we are approaching a cycle high. On that basis, the risk is skewed to the downside in the near-term. Therefore, I feel that buying Bitcoin at the current level carries too much risk for conservative investors. But for investors with a high-risk tolerance and a long-term horizon, Bitcoin may offer value. However, I strongly advise against using leverage.
For more market insights, follow Elliott on Twitter.

This article is provided for informational purposes. Do your own research and don’t risk more than what you are willing to lose. Leveraged trading can cause you to lose more than your deposit.