The Bitcoin Cash price prediction will be determined by the outcome of the emerging pattern on the charts. The pattern in question is the descending triangle, pointing to a further downside move on the BCH/USDT pair unless the bulls can pull off a surprise.
Bitcoin Cash presently trades around the $110 mark after the market crash erased $1.5 billion from its market capitalization in May 2022. The bearish market trend persists, which could further erase the market value of the Bitcoin analogue. June 2022 brought a further 28% decline in market capitalization.
Rising interest rates have been damaging to risk-associated markets, and with some FOMC members still talking of a 75bps rate hike in July 2022, crypto investors may be in for a long winter. The Bitcoin Cash price prediction indicates the potential opportunities on the short-term charts. What are the potential plays as the year’s first half grinds to a close?
Bitcoin Cash Price Prediction
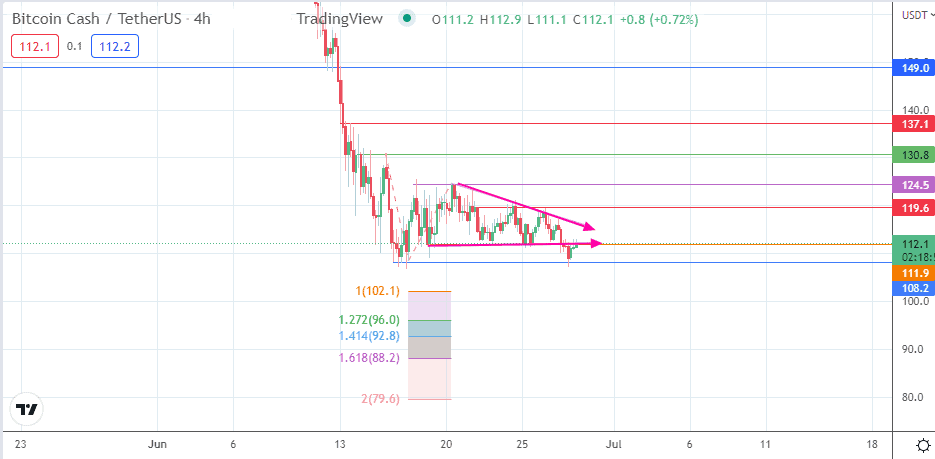
The 4-hour chart shows a descending triangle pattern whose lower border was broken by this morning’s price action. However, a return move is in progress, but this appears to have been capped by the triangle’s lower edge at 111.9 (25 June low), now acting as a resistance level. If this border resists the return move, the bears will come into the fray to force the price action toward the 108.2 support.
A breakdown of this level sends the BCH/USDT pair toward the pre-hard fork lows, with 102.1 and 96.0 serving as the immediate targets to the south. These are the potential pivots formed by the 100% and 127.2% Fibonacci extension levels, traced from the swing high of 16 June to the swing low of 27 June and ending at the 20 June high.
On the other hand, a break of the 111.9 resistance by the return move invalidates the breakdown temporarily. This move must break the triangle’s upper border and the 22 June high at 119.6 to reverse the short-term trend. This scenario will see 124.5 become a new target to the north, with 130.8 and 137.1 serving as additional northbound targets.
BCH/USDT: Daily Chart