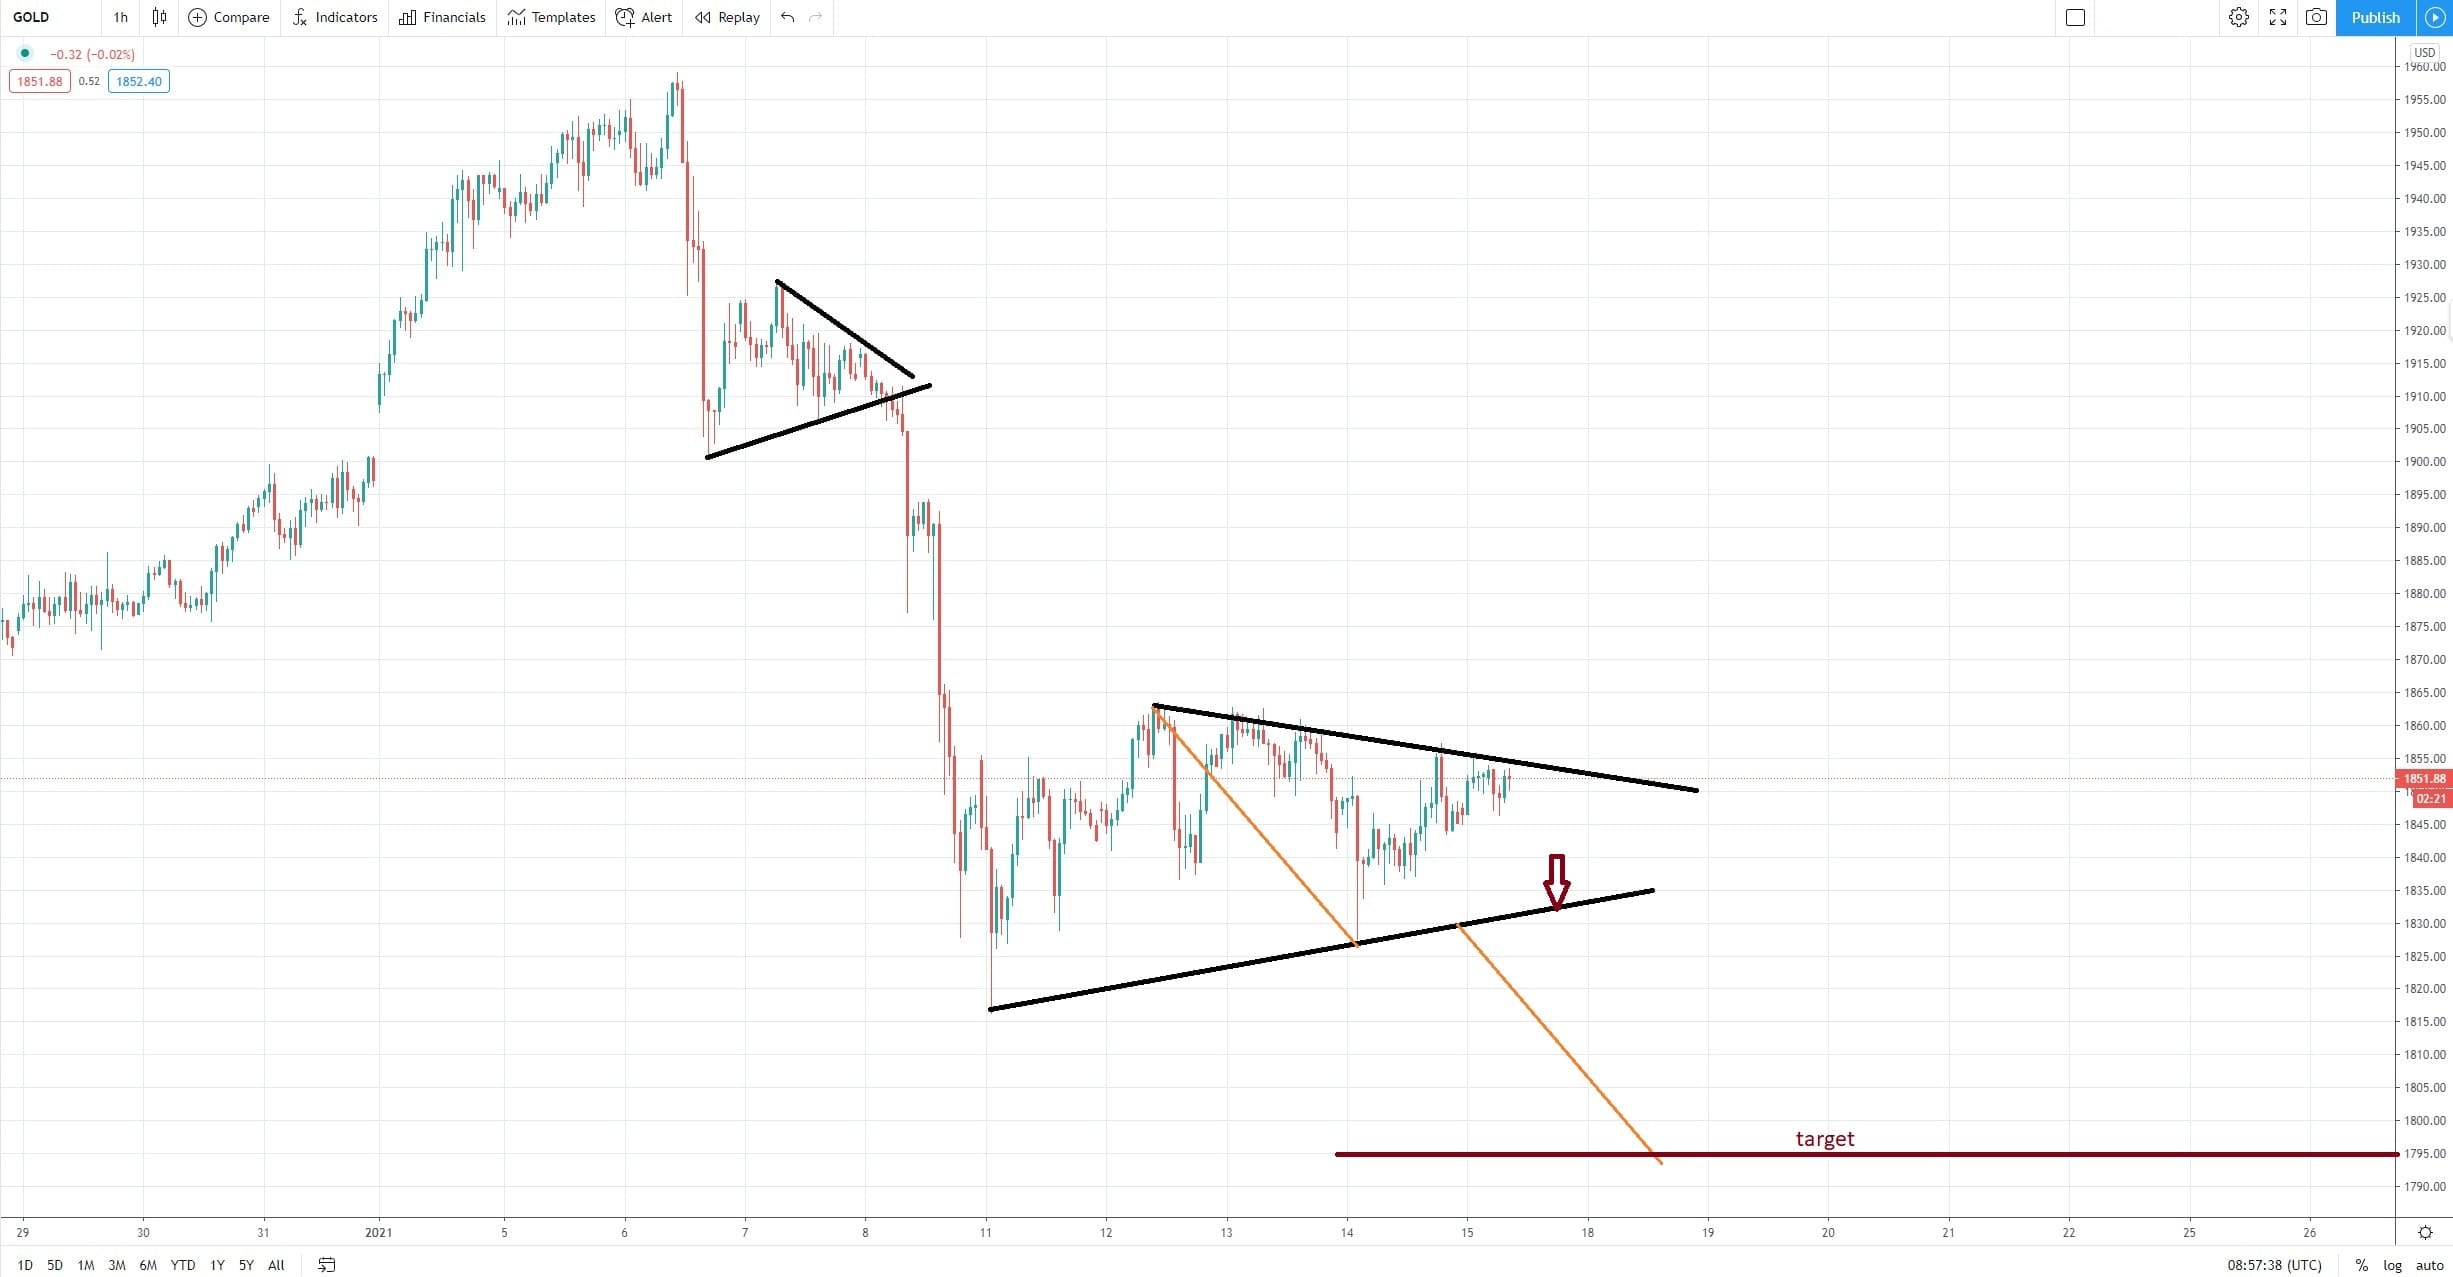

- Gold price ready for another leg lower as suggested by a symmetrical contracting triangle. On a break lower, bears may target $1,795.
The gold price looks weak here as the market forms a triangle as a continuation pattern. Since the second rejection from the $1,960, the price of gold was not able to put a meaningful bounce. As such, it just consolidated on the horizontal, looking for direction.
The market this week traded with a mixed tone, and by the market, we talk about the dollar. As the price of gold on the chart below is expressed in dollars, what happens to the world’s reserve currency plays an important role in the price of gold.
As mentioned already, the dollar traded with a mix tone – it dropped against the GBP or the AUD but strengthened against the EUR. Which market leads and which market lags?

Gold Technical Analysis
A triangle as a continuation pattern is either ascending or descending or a symmetrical triangle. In our case, both triangles seen below are symmetrical contracting triangle. The measured move implies another leg lower in the price of gold, one that should lead to $1,795 or below. As such, bears may want to wait for the price of gold to break the lower edge of the triangle before going short with a stop at the highest point in the triangular formation and a target of $1,795 or below.
Gold Price Forecast