


- The Avalanche price action has become unpredictable after reaching the $100 milestone on Monday and is typical of 'price discovery'
The Avalanche price action has become unpredictable after reaching the $100 milestone on Monday and is typical of ‘price discovery’ when an asset makes a new high. With the AVAX price close to its all-time high, this article highlights the significant technical levels to keep an eye on.
Avalanche (AVAX) has outperformed in October, gaining +35.70% so far this month, bringing its year-to-date performance to +2,700%. The layer-one blockchain’s market cap has grown significantly over the last few months and is currently around $19.14 billion, ranking Avalanche the 13th most-valuable cryptocurrency behind Terra (LUNA). The impressive performance of the AVAX token follows the blockchain’s growth in Decentralized Finance. Avalanche currently has a Total Value Locked (TVL) of $10.18 billion and is the 5th-largest DeFi blockchain. But whilst the fundamental growth is encouraging, we should remember the AVAX price has increased over 620% in the last four months, which leaves it vulnerable to a violent correction.
Avalanche Technical Analysis
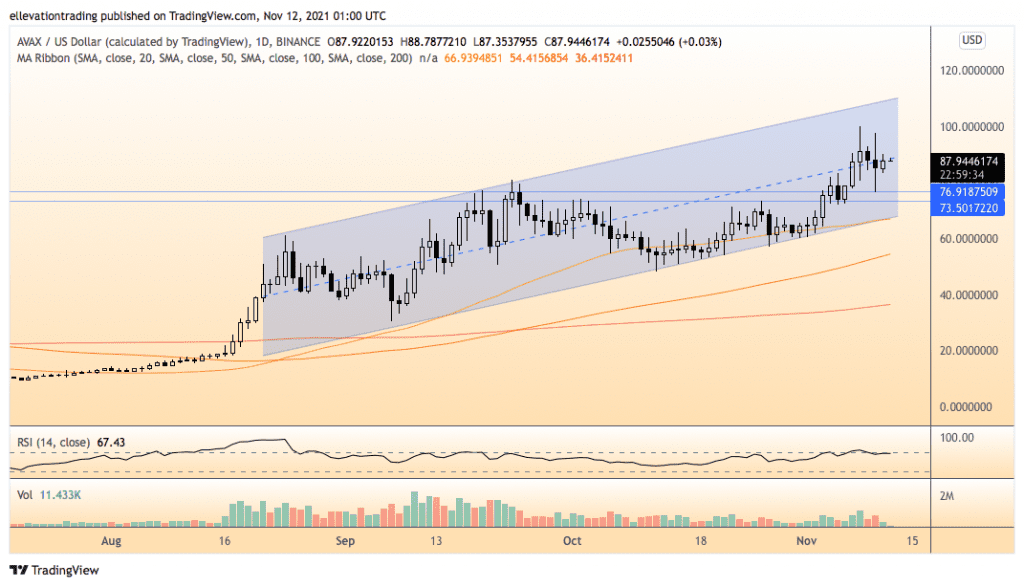
The daily chart shows, Avalanche is trending higher in a rising parallel channel. The price is trading close to the mid-point of the formation, suggesting it could soon move towards either top or bottom of the channel.
If AVAX clears $91.15 (highest-ever closing price 8/11), I expect it to extend to exceed the all-time high and advance to the top of the channel at $109.00. Furthermore, a break above $109.00 could trigger an overshoot into the $120-$140 range. However, at 67.4, the Relative Strength Index is approaching overbought. Therefore, a parabolic extension could be short-lived.
On the downside, a break below yesterday’s $76.75 low should deliver an extension to the bottom of the channel at $66.60. The 50-Day Moving Average at $66.94 reinforces the trend support, which may encourage dip-buying. As long as the AVAX price maintains the trend-line, it should trade with a bullish bias.

However, a break below trend targets the 10-Day moving Average at $54.41. Considering the strong bullish trend, I expect the price will continue higher overall. However, my preference is to buy into weakness rather than chase strength. Therefore, investors should look for entry points towards the bottom of the trend channel.
Of course, the optimistic outlook relies on trend support holding. On that basis, a close below $66.60 invalidates the bullish thesis.
AVAX Price Chart (Daily)
For more market insights, follow Elliott on Twitter.