

- AUD/USD head and shoulders pattern suggests a move to 0.72 is possible. Bears will likely sell against the highs now that the price has met resistance.
The AUD/USD pair has bounced recently from below 0.76 and trades with a bid tone for the last couple of weeks. However, the move higher appears to be part of the right shoulder of a head and shoulders pattern, so the bias is actually bearish.
The problem with the head and shoulders pattern seen below is the timeframe. Because it forms on the daily chart, it is visible to market participants, and thus the trading algorithms will try to invalidate it.
Yesterday it was a bank holiday in Australia. Coupled with the traditional low volatility ahead of the FOMC Statement and press conference, the activity on the AUD/USD pair was quite slow. As such, it correlated with the stock market in the United States.
Therefore, while the S&P500 made a new all-time high yesterday, the AUD/USD followed promptly and ended the day at the highs. However, it met horizontal resistance, and bears will likely take their chances at this point.

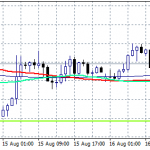
AUD/USD Technical Analysis
The technical picture reveals the price action meeting horizontal resistance. Because of the timeframe, this is strong resistance to be broken easily. Therefore, bears may want to stay on the short side with a stop at the highs and a take profit into the 0.72 area, as indicated by the pattern’s measured move.
AUD/USD Price Forecast

Follow Mircea on Twitter.