
After spending some time off its 2021 highs, the ANKR/USDT pair could be poised for a push to the north. This is because the emerging falling wedge pattern on the daily chart is pushing new bullish ANKR price predictions.
What is responsible for the upbeat ANKR price prediction? On the fundamental side of things, there is the fact that ANKR is now the leading Web3 remote procedure call (RPC) provider, with over 6 billion requests being processed daily. ANKR now supports inter-process communication for 15 supported blockchains, including Solana, Ethereum, Fantom, Polygon, Binance Smart Chain, IoTeX and Nervos.
ANKR has also developed a tool to query NFTs in an innovative move said to be an industry first. The ANKR scan will also provide for analysis of multiple chains, which is expected to enhance the upscaling of Web3.0 functionality for various projects.
Technically speaking, the emerging pattern on the daily chart supports recovery in the ANKR price. The pattern is now facing a test of the break by the bulls. Here is the ANKR price prediction for the week.
ANKR Price Prediction
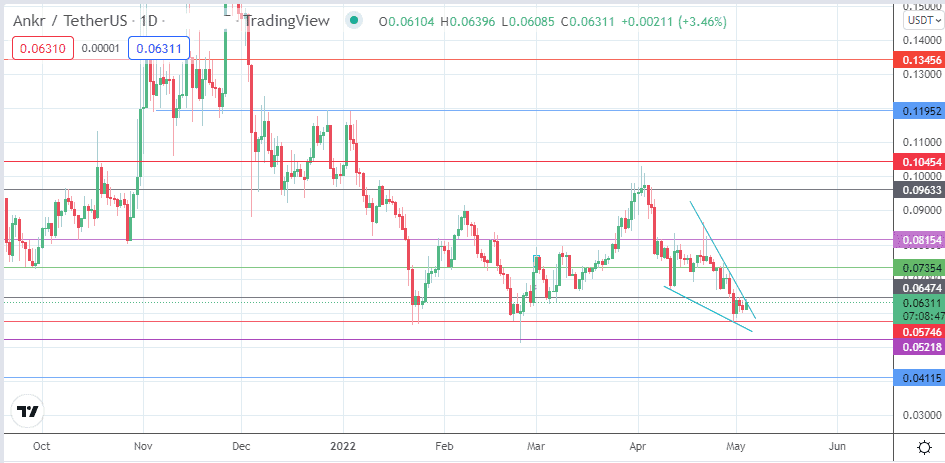
The falling wedge on the daily chart will be complete on a break of the upper border at the at 0.06474 resistance level (25 February and 2 May highs). This break point to a completion point for the measured move at the 0.08154 resistance level (30 January and 12 April 2022 highs). To attain completion, this measured move must take out an intervening resistance barrier at 0.07354 (15 March and 26 April highs). Additional targets to the north that lie beyond the measured move’s completion are at 0.09633 (6 January and 1 April highs) and at 0.10454.
Conversely, rejection at the 0.06474 resistance sends the price activity towards the opposing wedge border at 0.05746 (22 January and 30 April 2022 lows). Below this level, additional support is seen at 0.05218 (21 July 2021 and 23 February 2022 lows). Only when this support is degraded will the 0.04115 support level (22 February 2021 low) come into view.
ANKR/USDT: Daily Chart
Follow Eno on Twitter.