
Amazon stocks are trading lower along with several Nasdaq-listed technology stocks. Even as traders sold off their holdings to cash in on profits from positions entered at lower prices, the 1.94% decline on the Amazon price has not deterred the bullish Amazon stock price forecasts. These forecasts could kick in soon if the latest news regarding the stock is anything to go by.
Reuters is reporting this Tuesday that Amazon has secured a contract from Europe’s Arianespace, Blue Origin and United Launch Alliance (ULA) to launch 83 rockets over the next five years as part of Project Kuiper. Project Kuiper is to develop and beam broadband internet, serving as a competing service to Elon-Musk’s Starlink.
Project Kuiper will cover the entire globe using 3,000 low-orbiting satellites, delivering low-latency, high-speed internet to businesses, households and governments using launch capacity from multiple providers. Vice President of Technology for the project, Rajeev Badyal, believes that sourcing launch capacity from various providers can prevent issues associated with a single point of failure and deliver cost savings that can be passed down to consumers.
The multiple providers of launch capacity include Arianespace with 6 rockets and Jeff Bezos’s Blue Origin New Glenn launcher, which will carry out 12 launches, ULA’s Vulcan Centaur rockets will perform 38 launches.
The development could give the Amazon stock price a tremendous boost when it eventually kicks in and could provide the support needed for the potentially bullish pattern developing on the daily chart.
Amazon Stock Price Forecast
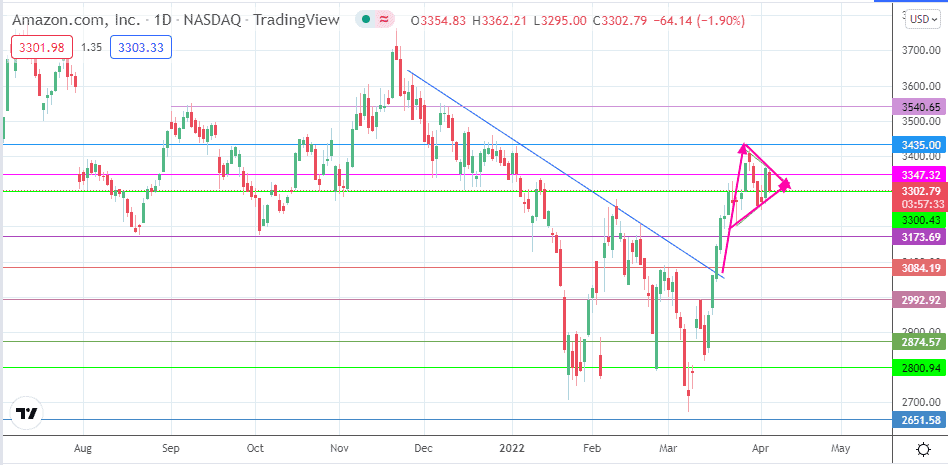
The intraday decline preserves the 3347.32 resistance level following Monday’s violation. Tuesday’s decline presents another touchpoint for the descending line that forms the upper border of the triangle. The active daily candle has met support at the 3300.43 support. The bulls need to defend this support to preserve its integrity and that of the triangle. If this support level breaks down, the pattern is invalidated, and the door opens towards the 3173.69 support mark. 3084.19 (28 February high) forms an additional target to the south, as does 2992.92 if the former fails to prevent continued selling action.
On the other hand, if the price candle bounces off 3300.43 and eventually takes out the 3347.32 resistance, the triangle’s upper border will also give way. If the pattern is viewed as a triangle, this breakout will conform to the pattern’s expectation as a continuation pattern. This scenario would favour a move that has to attain the 3540.65 resistance, taking out 3435.00. The same expectation prevails if the pattern is viewed as a bullish pennant, as the measured move that conforms to the pole also attains completion at 3540.65.
Amazon: Daily Chart
Follow Eno on Twitter.