The FTSE 100 index is having a choppy day of trading but is essentially trading lower as the initial losses gave way to gains and have gone back to losing territory.
Topping the gainers’ chart are HSBC, Barclays, and Fresnillo stocks this Tuesday. Standard Chartered, Glencore and Vodafone also made it into the top 10 gainers’ chart, as did BAE Systems and BT Group, two shares we commonly cover on this site.
Barclays continues to revel in its share buyback program, which has generated keen market interest. Vodafone continues to ride high from last week’s emergence of a new majority shareholder from the UAE. BAE Systems is enjoying new patronage from its new multi-billion defence contracts, and Glencore is seeking to make it seven winning days in eight as it seeks to resolve corruption probes in the US.
With the biggest gainer only up by 3.59%, it is no surprise that the FTSE 100 index is trading lower as the losing stocks have overwhelmed the gainers. ITV, Royal Mail and Scottish Mortgage Investment Trust are among today’s biggest losers on the FTSE 100. In addition, Scottish Mortgage appears to have fallen off the cliff after posting yet another losing day on Tuesday, falling 5.01%. Since hitting highs of 1568.6p on 5 November 2021, the stock has shed more than half its value after posting losses in more than 160 out of 200 days of trading since then.
Stocks of retailers, supermarkets and fast-moving consumer goods producers were all in the red after it emerged that consumer inflation in the UK’s retail sector was now at 13-year highs. Consequently, Ocado Group, Associated British Foods, Coca Cola and Tesco were all in negative territory.
The FTSE 100 index is down 0.13% currently.
FTSE 100 Index Outlook
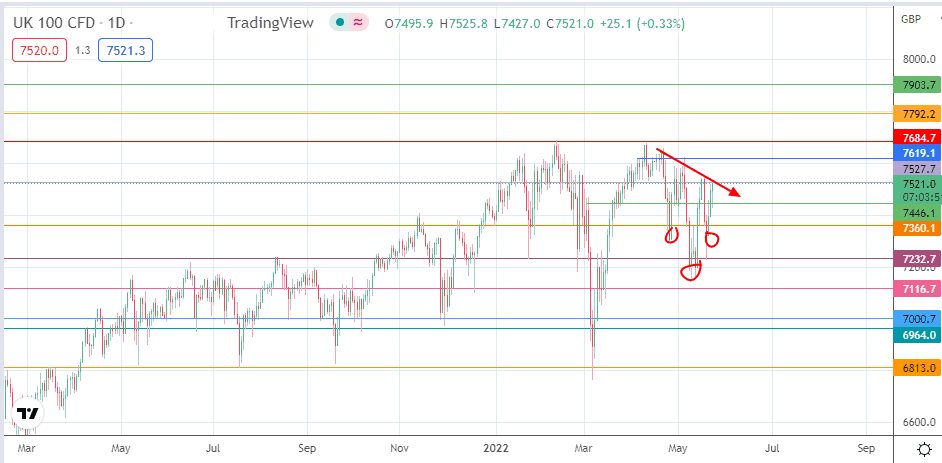
The emerging pattern on the daily chart is that of an inverse head and shoulders pattern. A neckline break at the current resistance (7527.7) completes the pattern. With the measured move expected to check-in at 7792.2 (15 January 2018 and 6 August 2018 highs), the breakout move must also take out sequential resistance barriers at 7619.1 (5 May high) and 7684.7 (30 December 2019/17 January 2020 double top, and 10 February and 11 May highs).
On the flip side, a rejection at the 7527.7 resistance provides for a retreat to retest the support at 7446.1 (24 March low). 7360.1 (26 January and 22 February) and 7237.7 (19 May low) are the immediate support targets below this level if the bulls fail to defend it, while 7116.7 rounds off the short term harvest points for the bears if the price deterioration continues.
FTSE 100: Daily Chart