

- Bitcoin price trades on negative foot as the number one cryptocurrency consolidates close to recent lows above the 10,000 after the sharp correction the
Bitcoin price trades on negative foot as the number one cryptocurrency consolidates close to recent lows above the 10,000 after the sharp correction the previous week. Bitcoin has lost over 15% in just two days and dropped from 12,000 to monthly lows, cancelling the bullish momentum. A sell-off in tech stocks lead to a correction in the cryptocurrencies as investors took some profits off the table.
The risk-off sentiment helped the USD to rebound from the two-year lows while sent the dollar-denominated assets to lower levels.
All major cryptocurrencies are trading lower today, ETHUSD is the outperformer giving up 1.47% at 347.56, Litecoin is 0.56% lower at 47.62 and XRPUSD is 0.77% lower at 0.2380 having breached below the 50-day moving average and now testing the next support at 100-day moving average. I have discussed the implications of a move below the 50-day MA in the previous week article: Ripple Price Can Bears Break the 50-Day SMA?
The Bitcoin capitalization has dropped now at 187.80 billion while the market cap of the top 100 cryptocurrencies now stands at 325.38 billion.
Bitcoin Technical Analysis
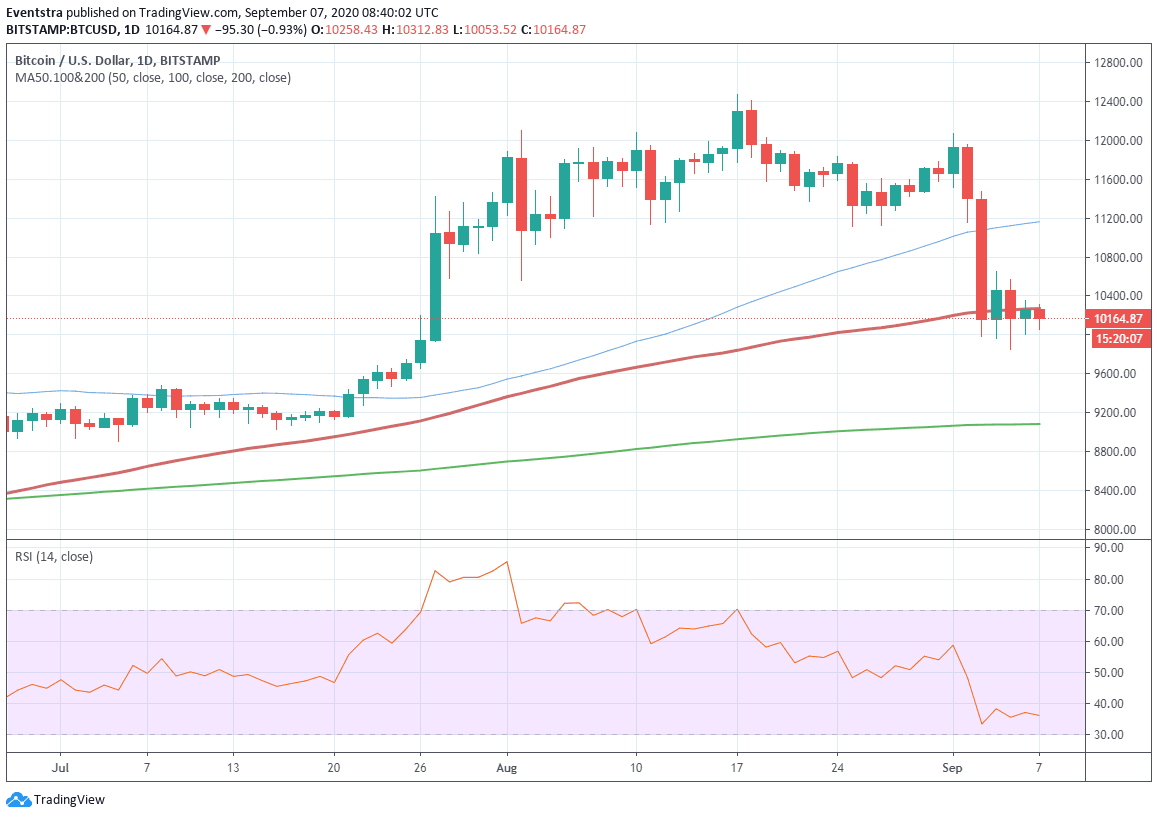
Bitcoin price is 0.81% lower at $10,177, as price attempts to consolidate above the 10,000 mark and around the 100-day moving average.

BTCUSD has meet resistance today at 10,270, which is critical for the next Bitcoin trend. If Bitcoin close today below the 100-day SMA then bears might challenge 9,870 the low from September 5 trading session. A break below 9,870 would open the way for 9,655 the low from July 26.
On the flip side, if Bitcoin breaks above the 100-day moving average at 10,270 would cancel the short term bearish outlook. The next hurdle would be met at 10,630 the top from September 4. The next supply zone stands at 11,161 the 50-day moving average.
Investing Cube runs one-to-one Trading Coaching, which is a great way to learn these techniques.
Bitcoin Price Daily Chart