
Ripple price testing for the second day the 50-day moving average and bounce, at least for now, as the correction for the number four cryptocurrency continues. XRPUSD tested and bounced successfully from the 50-day moving average again on August 27. Bulls have lost control below the 0.30 mark as I have mentioned in my previous article: Ripple Price Bulls In Control Above 0.30.
Bithumb Investigation Weigh on Cryptocurrencies
The major cryptocurrencies (Bitcoin, Ethereum, Litecoin) are also under selling pressure after the news that police raided the biggest cryptocurrency exchange in South Korea, Bithumb. The investigation came after allegations of fraud committed by Bithumb’s main shareholder. The investigation focus is on the BXA token issuance as investors lost their money after the number one crypto exchange in South Korea failed to list the token in its platform.
India’s Prime Minister Modi’s Twitter Account Hacked
India’s PM Modi’s Twitter account, hacked by hackers who posted several tweets asking the prime minister’s followers to donate to a Relief Fund for coronavirus. Analysts said that no cryptocurrencies send the crypto wallets referred in the tweets.
Ripple Price Daily Technical Analysis
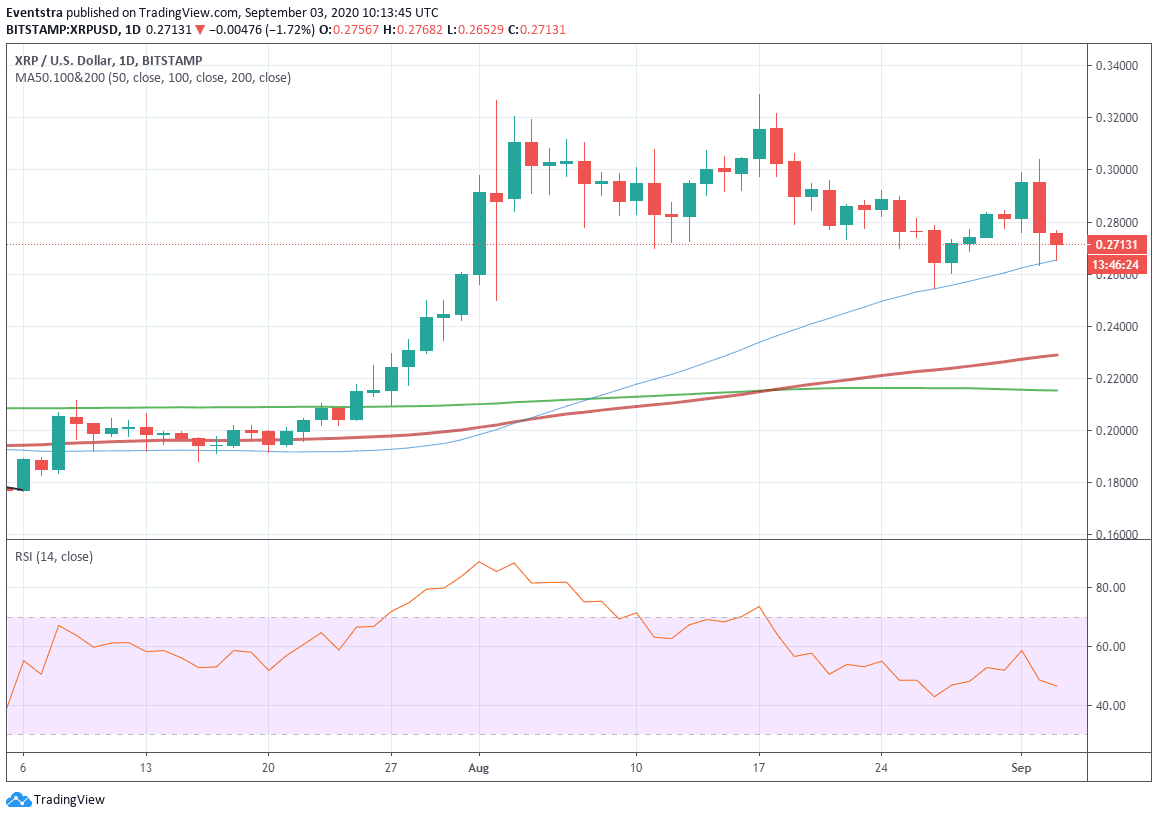
Ripple price is under pressure for the second straight day and as of writing giving up 1.62% at $0.2716, but off the daily lows that hit earlier during the Asian session at the 50-day moving average. XRPUSD managed to rebound for the third time from 0.2650 region and bullish traders hope today for a credible close above the 50-day moving average.
If the selling pressure, push Ripple price below 0.2654, then more sellers might join the action for an attempt to the next support at 0.2533 the low from August 27.
On the upside, intraday resistance stands at 0.2768 the daily top. More selling pressure might emerge at 0.3040 the high from yesterday’s trading session. If the bulls break that hurdle, then the next target would be the high from August 18 at 0.3212.
You can check One to One Trading Coaching to learn more about trading entries, stop-loss, and take profit strategies
Don’t miss a beat! Follow us on Telegram and Twitter.
Ripple Price Daily Chart
More content
- Download our latest quarterly market outlook for our longer-term trade ideas.
- Follow Nikolas on Twitter.
- Do you enjoy reading our updates? Become a member today and access all restricted content. It is free to join.