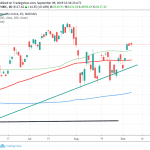
- The Nasdaq 100 is pushing to new all-time highs, but the measured move from the ascending triangle's breakout point suggests nearing exhaustion.
The Nasdaq 100 index continues to defy the odds by pushing to new all-time highs this Tuesday. The Nasdaq 100 index is currently trading at 8362.50 (as at the time of writing), after having touched off intraday highs at 8372.60.
The Nasdaq 100 continues to experience bullish moves after Japan’s lower house of parliament gave its assent to a new limited trade deal brokered last month.
Under the new deal, tariff cuts on U.S. farm goods and Japanese machine tools will kick in next year. Optimism over the signing of a new US-China trade deal also continues to spill over from yesterday, as chipmakers continue to benefit.
Technical Outlook for Nasdaq
The symmetrical triangle on the daily chart of the Nasdaq 100 index has been decisively broken by the bullish push. However, the completion of the measured move from the breakout point could be in the offing, which could limit further upside beyond 8500.
Traders would therefore need to start applying caution at this stage, as a corrective pullback could be in the works before the week runs out. Some major news releases that will affect the US markets are awaited; this may play a role in price action for the rest of the week.
If profit taking comes into play, 8128.25 remains the likely support for the pullback move, as this area corresponds to the previous highs of daily candles of October 28-31. Below this area, 8008 comes into focus (July 26, September 11 and October 24 highs).


