Summary:
Almost all financial markets will trend and taking advantage of these trends is a popular way of trading Forex. The general idea behind a trend following strategy is that once a while every financial market will produce a very strong bias. The reason for the trend is typically a fundamental reason causing the price of an asset to strongly move upwards or lower.
As an example, in 2014 crude oil prices were trading around 110 dollars per barrel, however, with the introduction of shale crude oil production the market was flooded with crude oil and the price had to adjust lower. Eventually, crude oil prices reached $27 per barrel. Another example is the run-up in bitcoin prices from about $2.37 per coin in 2012 to $19,825 in 2017.
One benefit of a trend following strategy is that we do not need to be experts on the market in question, as the smart money creates the trends. The technical trend trader does, however, need to understand market psychology and figure out when to buy and when to exit to ensure profitability.
“Smart money” is people that understand the market fundamentals very well such as key industry players, and as they enter the market with large positions they will leave large footprints in the charts such a few days of strong buying or selling. After the early smart money has bought, more smart money investors buy, followed by early trend followers, and eventually, the masses pick up the trend and get involved. At one point the price will have risen or declined to extremes and that causes the smart money to get involved once again.
Ideally, a trader tries to catch a trend as early as possible to be able to maximize their returns, but they don’t want to enter too early as it easy to get involved in false trend starts. As trend trading is relatively easy to understand and implement it has gained in popularity amongst retail traders.
Another reason why trend following strategies have gained popularity among trading communities is the success of traders like Bill Dunn and his “Dunn Capital Management”. For decades, trend following traders such as Bill Dunn has been producing significant returns, all by following a relatively simple and mechanical trend following strategy.
The following screenshot contains the chart of the USD/JPY pair during the year 1995
- Almost all markets will trend and taking advantage of these trends is a popular way of trading Forex, but what is a trend following strategy? Find out now.
USD/JPY Trend During 1995

Applying Commentary to identify the trends and trend reversals

Counter-trend trading strategies
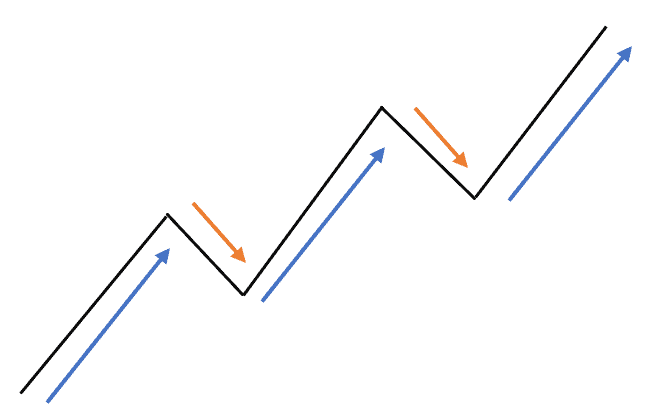
Counter-trend trading strategies are also utilized by some traders, who hope to catch the price corrections experienced during uptrends and downtrends. Price corrections refer to a move against the principal trend. On the other hand, counter–trend trading has more risk potential and much less potential profits as compared to trend trading. If we examine the chart below, we will find the general bias of the market to be upwards, and the corrections are against the general upwards bias. The price corrections will be much smaller if the trend is truly upwards. The blue lines show the profit potential of trading with the trend, while the orange lines show the profit potential of trading against the trend. However, it is not as easy to find those short-term highs that will allow traders to trade against the trend and most of the time the price will trade much higher than most traders will anticipate and lose money.Applying Commentary to identify the trends and trend reversals

Failure Swing

Non-Failure swing
