

- VIX index has come under intense pressure as the fear and greed index moves from the extreme fear zone to 28. What next for the fear gauge?
The VIX index has come under intense pressure as the fear and greed index moves from the extreme fear zone to 28. The decline also coincides with a period of strong performance across multiple assets like stocks, commodities, and cryptocurrencies. The Wall Street volatility index is trading at $27.26, which is about 22.3% below the highest point last week.
S&P 500, Dow Jones, Russell 2000 rising
The VIX index is the most common volatility gauge on Wall Street. It was developed by Goldman Sachs and CBOE to measure the amount of volatility in the market by using data in the options market. In most cases, the index rises when investors are fearful about the future and vice versa.
The CBOE VIX index is now retreating as investors focus on the strong performance in the equities market. Futures tied to the S&P 500, Dow Jones, and Russell 200 have all risen slightly on Monday morning. This is a continuation of how the market performed last Friday when the major American indices jumped by more than 2.5%.
The index sell-off also coincides with the upswing in the fear and greed index. For the most part of this month, the index has remained in the extreme fear zone of below 15. This happened as the S&P put and call options ratio has pulled back from this month’s high of 1.1 to the current 0.85.
Notably, despite the recent equities sell-off, the VIX index has not moved above $40, which is usually seen as the point of elevated levels in the market. Analysts believe that this is a sign that this is actually an orderly bear market. In a note, an analyst told Bloomberg that: “The current behavior is playing out similar to the 2000-2002 dot-com bear market, with no big sudden shocks but sustained high realized volatility.”

VIX index forecast
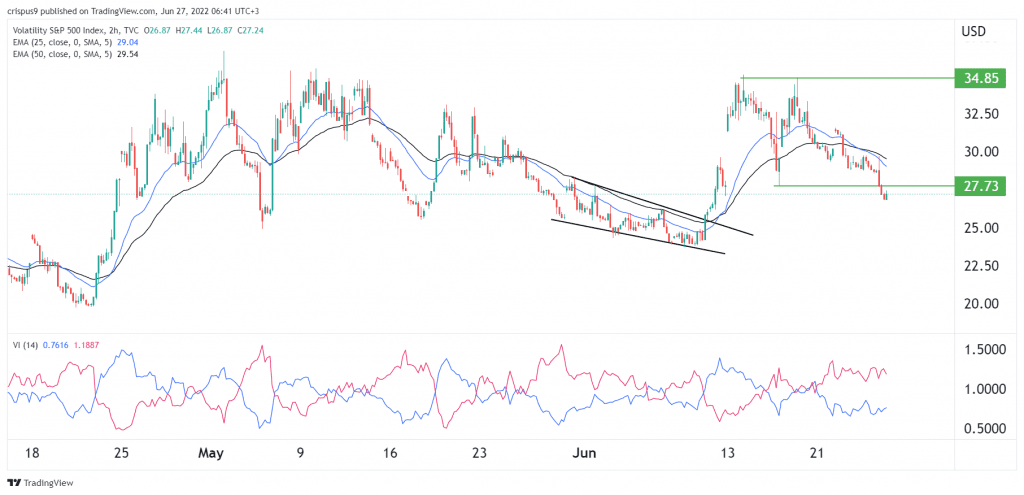
On the 2H chart, we see that the VIX index formed a double-top pattern at $34.85, which was the highest point on June 14th. It crossed the chin of this pattern at $27.73 on Monday morning, which is a bearish sign. The 25-period and 50-period moving averages have made a bearish crossover. At the same time, the spread of the Vortex indicator has widened slightly.
Therefore, the path of the least resistance for the VIX is lower, with the next key support level being at $25. On the flip side, a move above the key resistance at $27.73 will invalidate the bearish view. If this forecast is accurate, it means that American indices have more upside this week.