- The VIX index is crawling back as American stock futures pull back. What next as the Dow Jones, S&P 500 futures retreat?
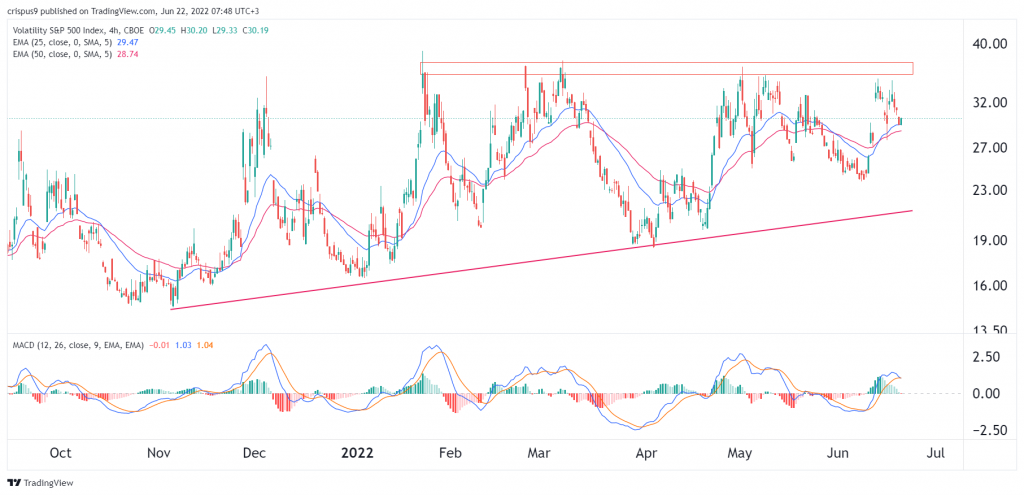
The VIX index is crawling back as American stock futures pull back. The index is trading at $30.20, which is about 3.3% above the lowest level on Tuesday. It has also rallied by more than 26.40% above last week’s low of $23.76. The fear and greed index has crashed to the extreme fear level of 20.
Dow Jones and S&P 500 futures retreat
The CBOE VIX index is a relatively important tool in the financial market. It uses options data to check the overall volatility in the S&P 500 index. A higher VIX figure is usually a sign that there is heightened volatility in the market and vice versa.
The VIX declined sharply on Tuesday as American equities rallied. The Dow Jones added over 640 points while the S&P 500 rose by over 90 points. The tech-heavy Nasdaq 100 index rose by more than 200 points as investors bought the dip.
Now, the situation has reversed and futures tied to the three have dropped by more than 0.50%. At the same time, bond yields have also retreated as bond prices rise. The yield of the 10-year government bond is trading at 3.26% while the 30-year is at 3.32%.
It is unclear why stocks are retreating. The most likely reason is that investors are waiting for the upcoming testimony by Jerome Powell, the Fed Chair. He will likely talk about the state of the economy and discuss the actions that the bank took last week. In its meeting, the bank decided to hike interest rates by 0.75% and pointed to more hikes in the coming months.
The VIX index is also rising after the latest results by Lennar, one of the biggest homebuilders in the US. In its report on Tuesday, the company warned that the housing sector was cooling as interest rates rise. The results came shortly after data showed that existing home sales declined sharply.
VIX index forecast
The daily chart shows that the VIX index faced a strong resistance level between $37 and $35. It has struggled moving above this point for a while. At the same time, the price is slightly above the ascending trendline that is shown in red and the 25-day and 50-day moving averages. The MACD is slightly above the neutral point.
Therefore, in my view, the outlook for the index is a bit bearish since it seems like it has formed a double-top pattern. A drop below the support at $27.69 will validate the double-top and drop to the support at $25. The invalidation point for this trade will be at $32.


