
- The VIX index jumped sharply this week after steadily dropping since June of this year. What next for the index?
The VIX index jumped sharply this week after steadily dropping since June. It is trading at $22.85, which is about 7.63% above last week’s low of $21.34. However, this price is about 37.54%, below the highest point in May this year. The rise coincides with the ongoing Dow Jones and S&P 500 sell-off.
Volatility inches up slightly
The VIX index is one of Wall Street’s most popular volatility gauges. It is used to measure the sentiment among investors by considering activity in the S&P 500 options market. In most periods, the index has an inverse relationship with the S&P 500, Dow Jones, Russell 2000, and Nasdaq 100.
This inverse correlation explains why the VIX declined to the lowest level since April this year in July. During the month, American and European stocks had their best performance since 2020. At the same time, the closely watched fear and greed index moved from the extreme level of below 25 to about 40.
The ongoing earnings season will be the next key catalyst for the Vix Index. More S&P 500 companies are expected to publish their results this week. Some of the most notable firms are S&P Global, KKR, Marriott International, Caterpillar, Molson Coors, Illinois Tool Works, and Starbucks.
The VIX index will also react to the upcoming US non-farm payroll (NFP) data scheduled for Friday this week. Analysts expect the numbers to show that the labour market in the US continued to expand, albeit at a slower pace. These numbers will provide more hints about the next interest rate decision by the Federal Reserve.

VIX index forecast
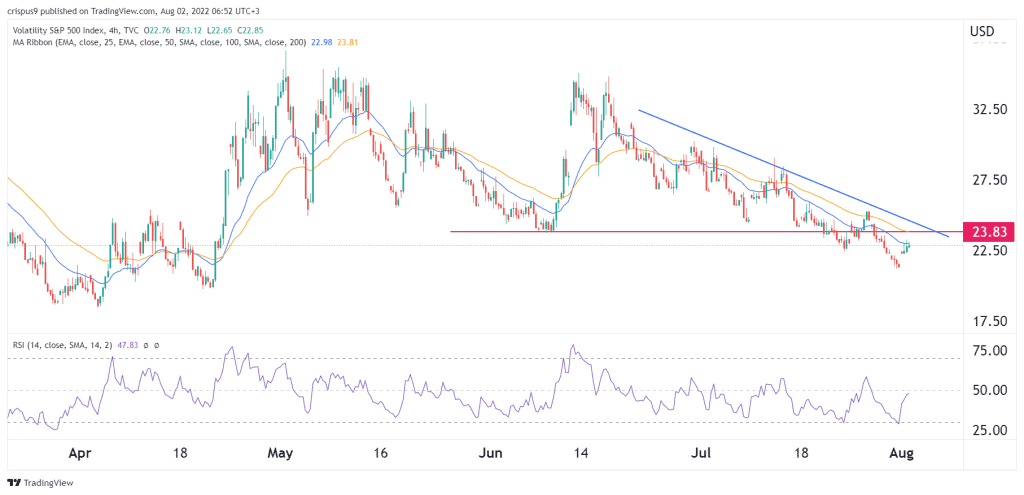
The four-hour chart shows that the VIX index has had a strong bearish trend in the past few days. As a result, the index has remained below the 25-day and 50-day moving averages. It has also dropped below the lower side of the descending trendline shown in blue.
Notably, the index dropped below the critical support at $23.83, the lowest level on June 8th. Therefore, the break and retest pattern indicates more weakness in the index. This means it will likely continue falling as sellers target the next critical support level at $20. A move above the resistance at $23.83 will invalidate the bearish view.