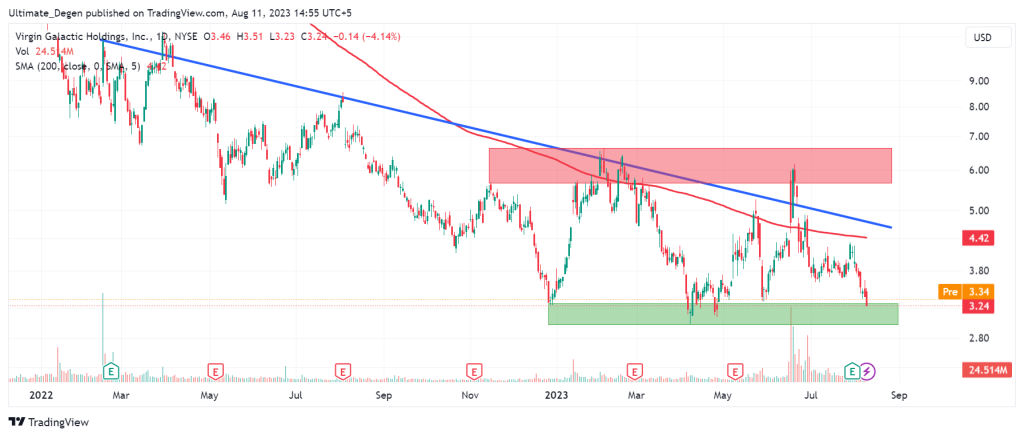
- Virgin Galactic Stock Price Chart - NYSE: SPCE is retesting a critical support level which may result in a bounce. My outlook remains bearish for the stock.
Virgin Galactic (NYSE: SPCE) stock price has been in a tailspin since the start of August 2023. After a 10.30% bounce in July, the stock lost 24.30% in the first ten days of August. Technical analysis shows that the stock is currently heading for a retest of the April lows which may result in a bounce.
On Thursday, US stocks showed a slight rebound after the release of the July CPI data. The data showed a 3.2% increase in inflation as compared to the market expectations of 3.3%. The markets initially reacted very positively to the report. However, most of the gains were lost before the day’s end.
NYSE: SPCE Plummets 4.14%
Despite a positive sentiment in the market, Virgin Galactic stock price still experienced increased selling pressure on Thursday. The stock closed the penultimate trading session of the week with a 4.14% loss, dropping to its lowest level since April 27.
The pioneering space tourism company released its Q2 earnings on 1st August. The report showed a wider loss in the second quarter than the same period last year. This caused a rejection from the 200-day moving average in Virgin Galactic shares, which were already facing headwinds. In Q2, Richard Branson’s brainchild launched two space flights, banking $2 million in revenue.
Virgin Galactic Stock Price Forecast
A look at the following NYSE: SPCE chart reveals that the stock is currently retesting a key demand zone. This demand zone has resulted in strong rebounds in the past few months. Virgin Galactic stock price forecast will flip extremely bearish in case of a breakdown below this support level.

There is also a high probability of another bounce from the $3-$3.25 level. Nevertheless, the price would remain bearish for me as long as it remains below the downward trendline, which is visible in the following chart.
In the meantime, you are also welcome to follow me on Twitter to keep track of my personal trades and the latest analysis on Virgin Galactic shares.