
- The VeChain price has collapsed 55% in the longest losing streak since the 2018 crash. But how much worse can it really get?
The VeChain price has collapsed 55% in the longest losing streak since the 2018 crash. But how much worse can it get?
VeChain (VET) is down 3.5% in Asian trading on Friday and on track for its worst weekly closing price in five months. Due to the relentless selling over the last five weeks, VET is trading at a 70% discount to the April all-time high and approaching the summer lows. Subsequently, the former high-flying cryptos’ market cap has dropped from $16.8 billion to around $5.35, ranking it the 31st most valuable digital asset.
Even as many cryptos reached new highs in November, the VET token never got close to equalling the $0.2800 record set in April. Furthermore, the underperformance continues as the market rolls over. As a result, the longer-term price action is starting to break down, suggesting more downside lies ahead. The question is, how much further can the VeChain price fall, and what needs to happen for bullish momentum to return?
VET Price Analysis
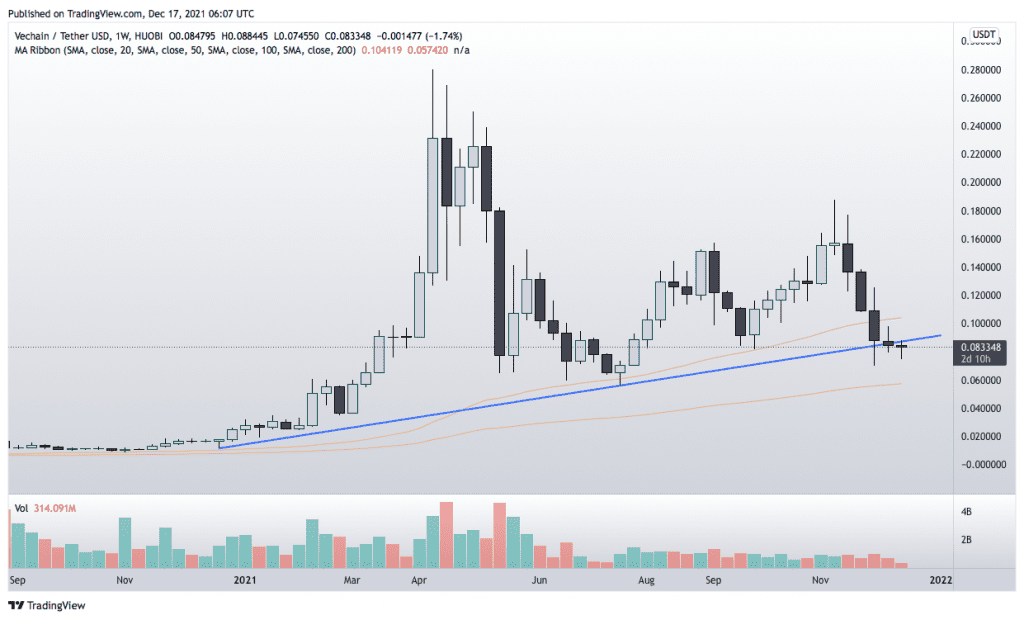
The weekly price chart highlights the severity of the current bear market. The token has broken down below rising trend line support (now resistance) at $0.8800, severely denting the technical outlook.
Unless VET climbs above the trend resistance, it should continue lower towards the 100-Week Moving Average at $0.5740. The 100-WMA is especially significant considering it lines up with the July lows. Therefore, a prolonged bear market could follow if the price falls below the long-term indicator.

However, VET will avert the immediate danger if it recovers the trend. Subsequently, a weekly close above $0.8800 invalidates the bearish outlook.
VeChain Price Chart (Weekly)
For more market insights, follow Elliott on Twitter.