
The USDZAR is in a tight range as investors waited for the upcoming nonfarm payroll numbers from the United States. Investors are also paying a close attention to the raging electricity cuts by Eskom that have put the South African rand at risk.
The perennial power issues have returned to South Africa, making it the biggest risk for the country’s economy. This week, Eskom, the troubled power company, announced that it would return to rotating power cuts. The goal of these cuts is to prevent the grid from being overwhelmed.
In a statement yesterday, Cyril Ramaphosa said that his government would work hard to ensure that these cuts don’t happen in the future. However, the previous actions by the government have not had much impacts. For example, the government has pumped capital to the company and even changed management. In a statement, an analyst at Bloomberg said:
“The single biggest risk to South Africa’s economic outlook remains the availability of electricity. It’s a binding constraint that continues to hold back productivity and investment growth. Without it, the country’s growth potential will remain stuck at around 1%.”
Meanwhile, the USDZAR is in a tight range as investors wait for the upcoming nonfarm payroll numbers from the United States. Analysts polled by Reuters expect that the US economy added more than 1.4 million jobs in August. They also expect that the data will show that the unemployment rate fell to 9.6% during the month.
USDZAR technical outlook
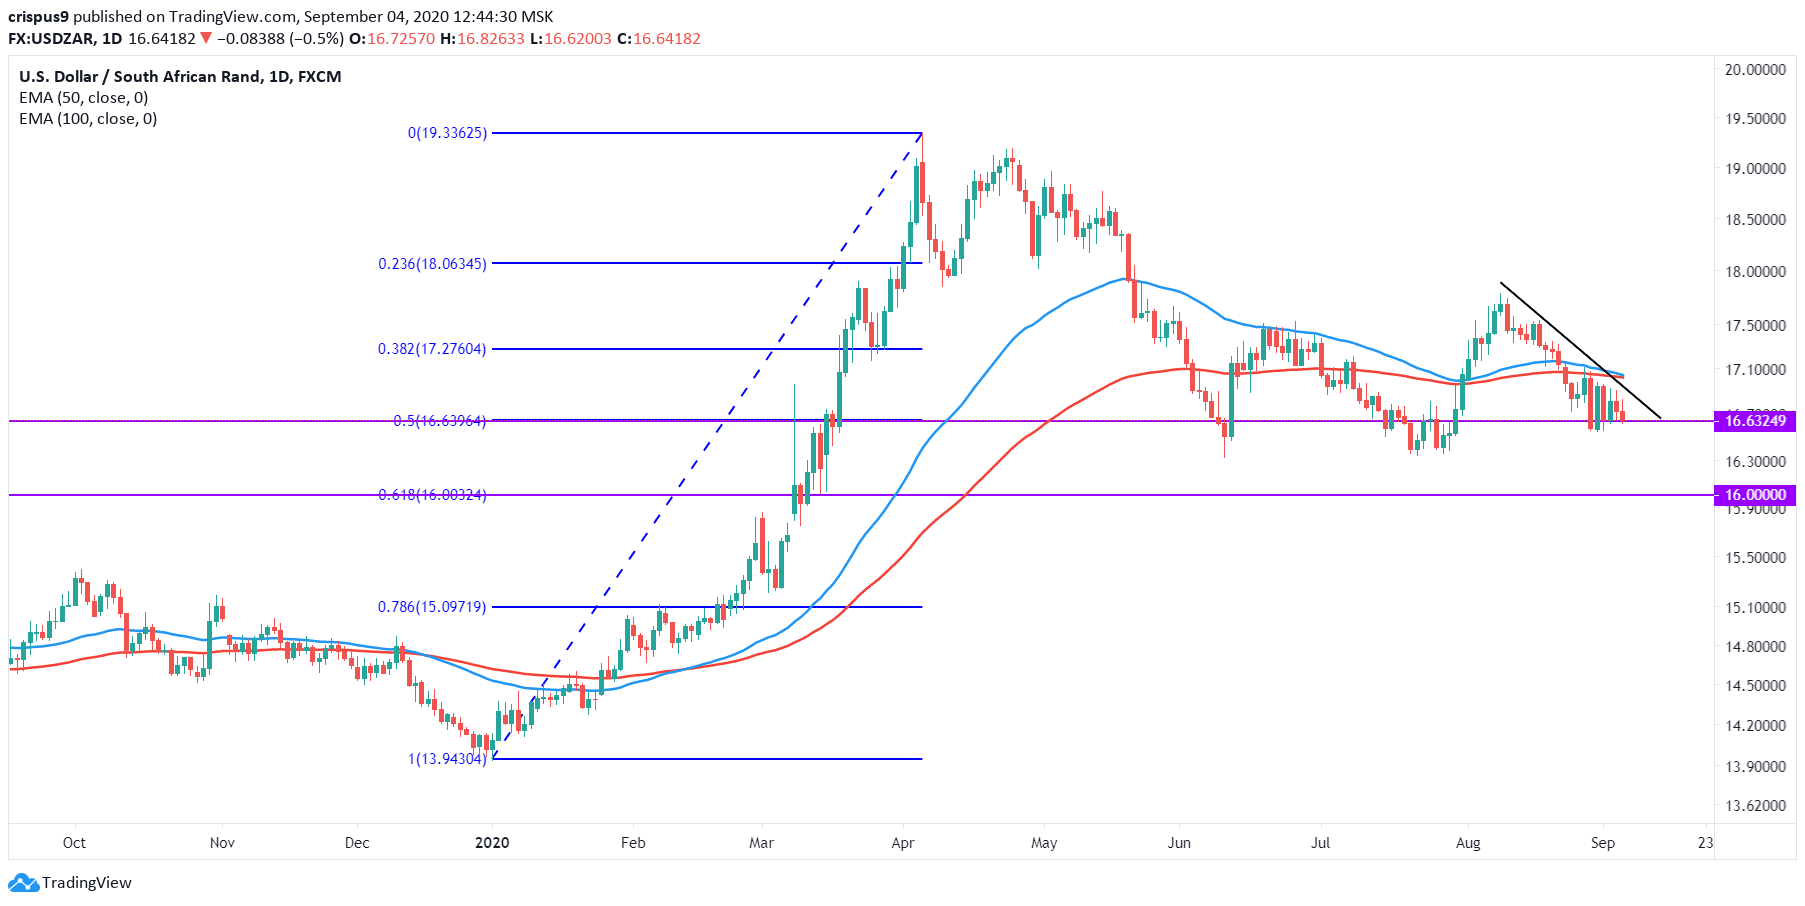
The USDZAR pair is trading at 16.6490, where it has been throughout the week. The price is also along the 50% Fibonacci retracement level on the daily chart. Therefore, it is clear that there is some indecision among traders on whether the price can fall further.
Still, the chart seems like it is in a strong downward trend, which means that the pair is likely to continue falling as bears target the next support at 16.000, which is along the 61.8% Fibonacci retracement level. On the flip side, a move above the 50-day and 100-day EMA at 16.100 will invalidate the bearish case.
Don’t miss a beat! Follow us on Telegram and Twitter.
USDZAR technical chart
More content
- Download our latest quarterly market outlook for our longer-term trade ideas.
- Follow Crispus on Twitter.
- Do you enjoy reading our updates? Become a member today and access all restricted content. It is free to join.