- USDMXN turns lower today after yesterday’s sharp gains as the dollar is under selling pressure across the board. Risk-off sentiment yesterday shifted
USDMXN turns lower today after yesterday’s sharp gains as the dollar is under selling pressure across the board. Risk-off sentiment yesterday shifted investors attention to USD and safe-haven assets as the new coronavirus cases rising in some U.S. states.
On the economic data news, the U.S. consumer price index (CPI) rose 0.6% above the expectations of a 0.5% increase. The yearly reading for Consumer Price Index came in at 0.6% in line with the consensus estimates. The Consumer Price Index excluding Food & Energy reported at 0.2%, topping the forecasts of 0.1%.
The NFIB reported that the small-business optimism index jumped 5.2 points to 100.6, marking the highest level since February 2020, analysts expectations were for a reading of 96. The United States Redbook Index increased to 3% on July 10 from previous -0.6%; the yearly reading came in at -5.5% above the prior reading of -6.9%.
Mexico has lost more than 1.1 million formal jobs since March when the coronavirus outbreak hit the country. Economists now expect that Mexico is on track for its most significant recession since the 1930s.

USDMXN Daily Technical Analysis
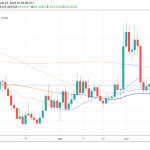
USDMXN is 0.51% lower at 22.6507 as the pair capped at the 50-day moving average, which proved a stiff resistance the last two weeks. The technical outlook short term momentum turned bearish now as the pair trades below the 100-day moving average. The long term momentum remains bullish as long as the pair holds above the 200-day moving average.
On the downside, initial support for the USDMXN pair stands at 22,5993 today’s low. The next support would be met at 22.3415 the low from yesterday’s trading session. Next support zone is at 22.1711 the low from July 6.
On the other hand, the immediate hurdle for the USDMXN stands at 22.7788 the daily top. A break above might push the pair towards 22.9111 the 100-day moving average. In case USDMXN breaks above 22.9111, then the next resistance will be met at 23.2503 the high from June 30.
USDMXN Daily Chart
