

- The USD/RUB price has moved sideways in the past few days as investors focus on the latest US jobs data and the upcoming inflation numbers
The USD/RUB price has moved sideways in the past few days as investors focus on the latest US jobs data and the upcoming inflation numbers. The USD to RUB exchange rate was trading at 60.56 on Monday morning, which was about 60% below the highest point this year. This price action is eerily similar to that of the EUR/RUB and GBP/RUB rates.
US data and oil prices
The USD/RUB price has moved sideways as Russia continued its diplomatic push in multiple countries. Last week, Putin met with Turkey’s Erdogan and the two pledged more integration even as Russia faces significant western sanctions. Russia has also deepened its ties with countries in Asia like China and those in Africa.
The recent strong recovery of the Russian ruble has faded as investors watch the recent performance of crude oil prices. Brent has dropped to about $92, while the West Texas Intermediate (WTI) has moved below $90. This is notable since Russia makes most of its money by selling oil and gas. And because of western sanctions, Russia has been selling some of its oil for as low as $30 to some countries. Urals oil was trading at $72 on Monday.
The USD/RUB price was also reacting to macro data from the United States. Data by the Bureau of Labor Statistics (BLS) showed that the unemployment rate dropped from 3.6% in June to 3.5% in July. In the same period, the economy added over 528k jobs. In addition, the US will publish the latest inflation data on Wednesday.
Recently, the Fed and the Russian central bank have moved in the opposite direction. While the Fed has been hiking interest rates, Russia’s bank has been cutting in a bid to support the economy.

USD/RUB forecast
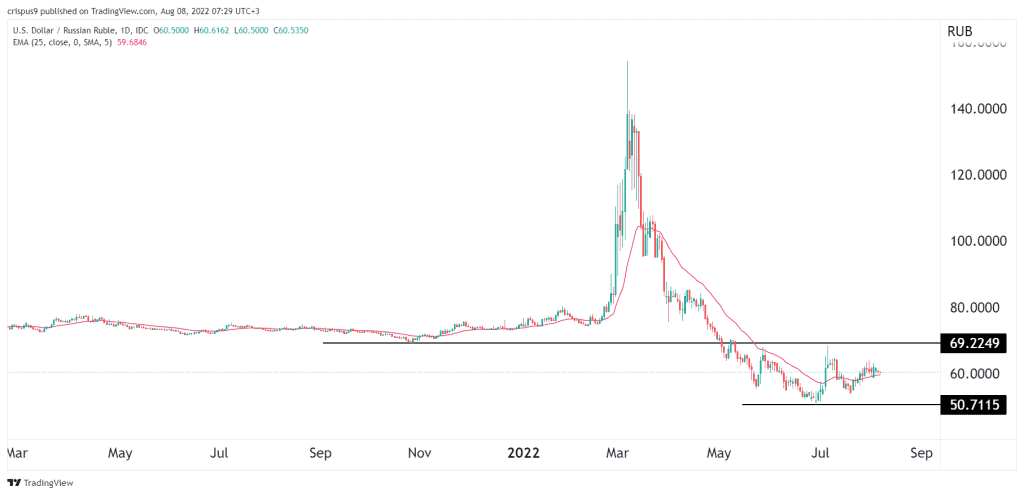
The daily chart shows that the USD to RUB exchange rate has been in a strong bearish trend in the past few months. It managed to move from a high of 154 in March to a low of 50.71 on June 30th. The pair remains between the important channel at 70 and 50 and is also consolidating at the 25-day and 50-day moving averages.
Therefore, this week, the USD/INR pair will likely remain in this range as investors focus on the energy market and US inflation data.