- The USD/RUB exchange rate remained in a consolidation phase on Monday as the Russian Urals crude oil price dropped.
The USD/RUB exchange rate remained in a consolidation phase on Monday as the Russian Urals crude oil price dropped. It was trading at 61.50, which was a few pips above last week’s low of 59.56. It has jumped by about 24% from its lowest level this year.
Russian Urals oil price slips
The USD to RUB exchange rate has been in a tight range in the past few weeks. This consolidation continued after G7 member countries placed a cap of Russian oil prices. The cap will work through insurance companies that focus on marine insurance.
These companies, most of which are western firms, will be allowed to insure Russian tankers only if the price of this oil is below the set target. For a start, officials placed the oil target at $60. As a result, the Russian Urals oil price slipped below this level. According to the Wall Street Journal, Russian oil was trading at $52, which was lower than the limit.
With Brent trading at $86, it means that this oil is trading at a $34 discount. The European Union and the UK started their embargo of Russian oil on Monday. Still, analysts believe that Russia will be able to evade these sanctions by creating a fleet of dark tankers. These are tankers that obfuscate their origin.
The USD/RUB price also wavered as the price of natural gas remained under intense pressure. It dropped to $5.88, which was lower than last month’s high of $7.4. Gas prices have tumbled during the winter season since Europe has secured alternative gas sources to replace the lost Russian gas. Germany inked a deal with Qatar last month.

The next key catalyst for the USD to RUB spot exchange rate will be the upcoming services PMI data from the US and Russia. Russia will also publish its inflation data on Wednesday. Analysts expect that the headline CPI eased to 12% last month.
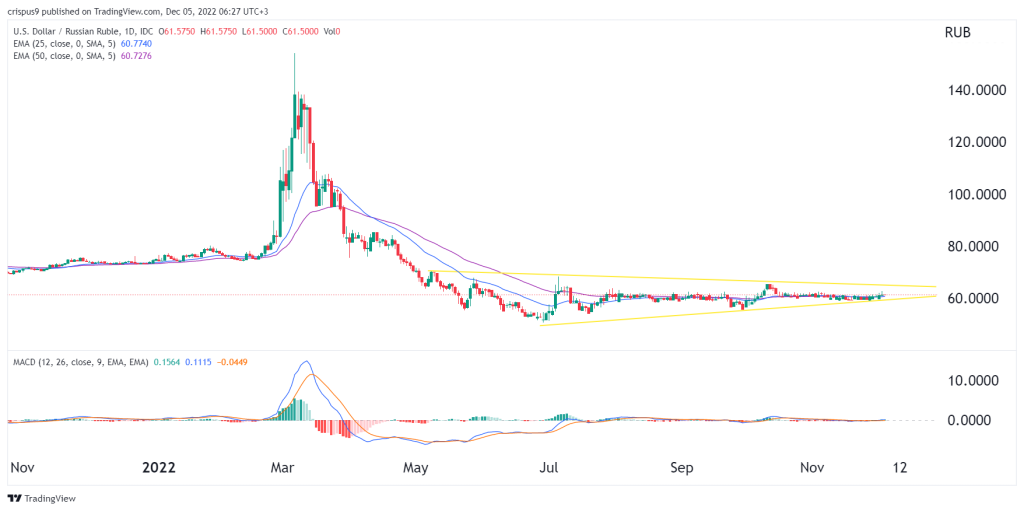
USD/RUB chart forecast
The daily chart shows that the USD to RUB exchange rate has been in a consolidation phase in the past few days. In this period, it has formed a symmetrical triangle pattern shown in yellow. It is also consolidating at the 25-day and 50-day moving averages while the MACD remains at the neutral point.
Therefore, with the triangle pattern nearing its confluence, there is a possibility that the pair will have a major bullish or bearish breakout soon. If this happens, the next key levels to watch will be at 65 or 55. At this stage, it is a bit difficult to predict whether the breakout will be bullish or bearish.