- The USD to MXN forecast offers us a hint that the prices are likely to continue dropping. Prices are likely to hit the 19.84 support level.
The USD to MXN forecast hints that the prices are likely to continue dropping. There is also a real possibility that the prices will hit the 19.84 support level. The ongoing war in Ukraine is having a massive impact on the strength of the dollar. Since the war began, the dollar has continued to strengthen in the past few days, with the dollar index significantly rising. This is because investors are now moving from risky investments during uncertain political times to safer investments. The US dollar has long been considered a safer bet, even in times of war. This is because most central banks use the dollar as their reserve currency. This makes it very hard to lose value in the long term.
Until two days ago, the US had also banned the importation of avocados from Mexico. This move has impacted the Mexican peso and resulted in the currency losing value against the dollar.
The Mexican economy has also significantly struggled during the covid pandemic. According to a report released by Economic Cooperation and Development (OECD) this week, Mexico is yet to recover to its pre-pandemic levels. Although the outlook of the economy is positive, and it is projected to rebound by the third quarter of this year, that has not helped its currency become competitive with the US dollar.
USD to MXN Forecast
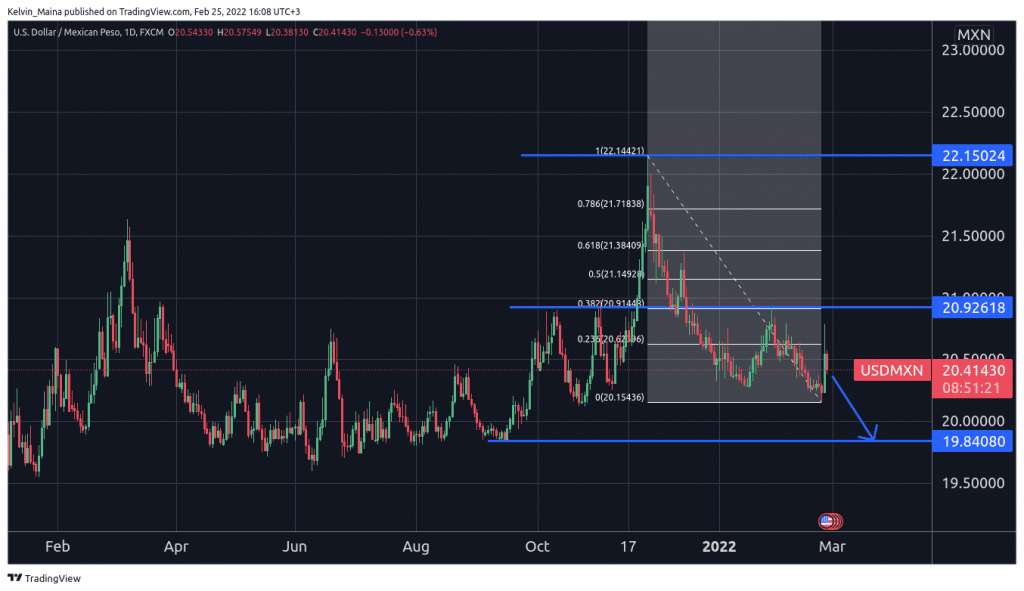
USD/MXN opened today’s trading session at 20.54, reaching highs of 20.57 and lows of 20.38. Currently, the pair is trading at 20.43, a 0.5 percent drop in price from today’s trading session.

Looking at the daily chart, the prices have retraced to 23.6 Fibonacci retracement level. Today’s trading session has seen the prices start to trend downwards again. The chart also shows that the prices are trading within a support and resistance market structure. After failing to break a long-term resistance level of 20.92, USD/MXN has been trading bearish since January 31st. Therefore, I expect the prices to continue with the current trend until they reach the 19.84 support level.
However, my technical analysis will be invalidated if the USDMXN prices reverse before hitting the 0.0 percent Fibonacci level. It will mean that the prices are reversing to the upside. If that happens, then you should expect a reversal to the upside.