

- The USD/JPY exchange rate jumped to a high of 138.43, which was the highest point since July as the Japanese yen crash continued.
The USD/JPY exchange rate jumped to a high of 138.43, which was the highest point since July as the Japanese yen crash continued. The pair has risen by more than 6.2% from the lowest level on August 2nd. It has risen by more than 22% this year, making yen one of the worst-performing currencies in the world. The EUR/JPY and GBP/JPY have risen by 11% and 8%, respectively.
Japan retail sales
The USDJPY rate rose to a high of 138.44 after the latest US consumer confidence and US retail sales data. Data published on Tuesday showed that the confidence rose from 95 in July to 103 in August. This data signaled that the Federal Reserve will continue hiking interest rates in the coming months. He also signaled that rates will remain substantially higher even when inflation starts coming down.
The USD to JPY price also rose after the latest Japan economic data. The numbers revealed that the country’s industrial production rose by 1.0% in July, which was better than the median estimate of -0.5%. It is estimated to rise by 5.5% in August, higher than the previous 3.8%. Additional data showed that the country’s retail sales rose by 2.4% in July from the previous 1.5%.
Japan also published the latest housing and consumer confidence data. Consumer confidence, which is an important data, rose from 30.2 to 32.5 in August. This increase was better than the median estimate of 29.4. Housing starts, on the other hand, dropped by 5.4%. Still, the divergence between the Federal Reserve and the Bank of Japan will continue widening.

USD/JPY forecast
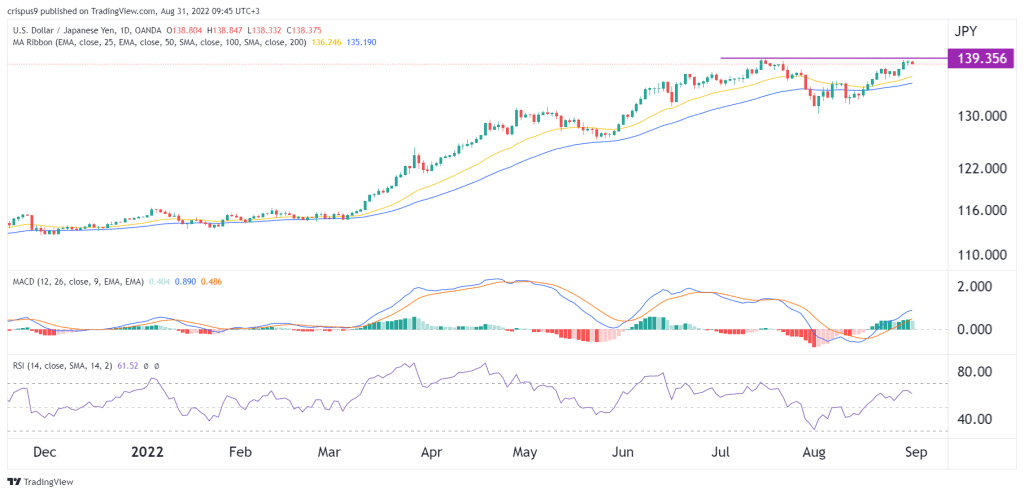
The daily chart shows that the USDJPY price has been in a strong bullish trend in the past few months. It rose to a high of 139.35 in July. A closer look shows that it is now attempting to retest the highest point this year. The pair has moved above the 25-day and 50-day moving averages.
The MACD and the Relative Strength Index (RSI) continued rising. The pair seems to be forming a double-top pattern, which is usually a bearish sign. Therefore, there is a likelihood that the pair will likely have a bearish breakout unless bulls push it above the resistance at 139.35. A move above this resistance will see it rise above 140.