
- The USD/CAD price pulled back slightly on Thursday as investors waited for the upcoming American consumer inflation data
The USD/CAD price pulled back slightly on Thursday as investors waited for the upcoming American consumer inflation data. It rose to a high of 1.3557, which was the highest level since November 4. It has risen modestly from this week’s low of 1.3380. The pair has jumped by more than 12% from the lowest level this year.
US consumer inflation data
The USD to CAD price has been in a strong bullish trend in the past few months as the US dollar index continued surging. The US dollar index, which measures the performance of the greenback against other currencies, has jumped by more than 16% this year. It has risen by more than 17% in the past 12 months straight.
The dollar has jumped because of the extremely hawkish Federal Reserve. The bank has hiked rates by 400 points and hinted that it will continue raising them for a while. Investors expect that the terminal rate will peak at 5.25% in the first quarter of next year. This makes the Fed more hawkish than the Bank of Canada.
The USD/CAD price will next react to the upcoming American consumer price index (CPI) data. Economists polled by Reuters believe that the headline consumer inflation remained at an elevated level in October. Precisely, they expect that inflation rose by 8.0% while core inflation rose by 6.5%. Still, there is a likelihood that inflation rose at a higher pace than expected.
The USD/CAD price also reacted to the extremely tight midterm elections in the US. The highly anticipated red wave failed to materialize, meaning that Biden will have more room to negotiate with the Republicans in Congress.

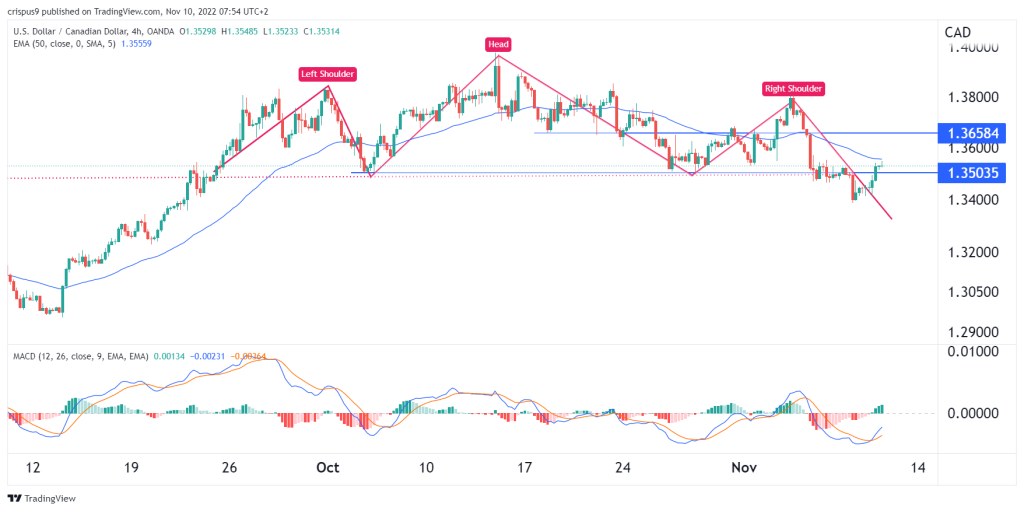
USD/CAD forecast
The 4H chart shows that the USD/CAD pair has bounced back in the past few days. It has managed to move above the important resistance level at 1.3500, which was the lowest level on October 27. It remains slightly below the 50-day moving average.
A closer look shows that the pair has formed a head and shoulders pattern. In price action analysis, this pattern is usually a bearish sign. Therefore, the pair will likely have a bearish breakout as sellers target the next key support at 1.3300. A move above the resistance at 1.3600 will invalidate the bearish view.