

Summary:
Chart patterns could be an excellent way of trading the markets if they suit your personality and if you are good at identifying them. A great benefit of chart patterns such as rectangles or the head and shoulders pattern is that they provide almost everything you need to have a structured way of trading. They provide an entry price, stop loss level, and take profit level. However, they do not provide rules for money management. The patterns are straightforward to trade when you understand them, but most patterns have a high failure rate which compensates with a good risk-reward ratio. The combination of low success rate and higher risk-reward ratio has helped me to trade well, yet, this style of trading is not for everyone because of the high failure rate. Also with the introduction of algo traders, and central bankers, and now even presidents, trying to smooth out the volatility of the markets pattern trading has become challenging.- Trading the head and shoulders pattern, and other chart patterns like the rectangle and ascending triangle could be of great advantage. Learn more today.
Focusing on Higher Time Frame Patterns
Some traders will trade classic patterns on the smaller time frames such as the four-hour chart, but I have found that they work better on the daily chart, and after they have been given time to mature. The problem with the patterns on the smaller time frames is that news and random market volatility can easily disrupt them. While moves on the daily chart are usually well-motivated by macroeconomic events.What Chart Patterns I focus on?
There is a large selection of patterns that traders will focus on, but they are not all of the same quality. Usually, patterns that include the break to a trendline such as the triangle pattern will be less reliable than a chart pattern made up by horizontal levels. That is why I focus on the following patterns:- Bullish and bearish Rectangles
- Descending, and ascending Triangles
- Bullish and bearish head and shoulders patterns.
Rectangle Pattern
The rectangle pattern is probably one of the easiest to spot on any chart and is a combination of several highs around the same level, and lows clustered around a different level. The reason for any market to trade sideways is because buyers and sellers are agreeing on the current price, and after a while, the range of the price becomes more important than the actual drivers of the market. As a hypothetical example, after a few months of little changes in the US and European economy the EURUSD starts to center around a level of 1.20, and every time the price reaches the 1.25 level traders sell and push the price down, while if the price declines to 1.15 traders buy the EURUSD pair. After a few weeks of sideways trading, the European economy starts to deteriorate as per a few economic indicators but the EURUSD remains range-bound between 1.15 and 1.25. At start traders ignore the economic data, but when the head of the ECB comments on the weak economy suddenly the EURUSD starts to challenge the 1.15 level. Traders that are long now become nervous and start to close their positions, at the same time bearish traders add to their bearish EUR USD exposure. Eventually, the price slips below 1.15 and starts to trigger stop-loss orders causing the price to close the day at 1.14. Here the price has had a successful breakout, and going forward more people will sell as they are losing money on their positions, and as the price in the EURUSD tries to catch up with the last few week’s negative news. Using the text-box example below of a rectangle pattern, traders would short at 1.14, with stops somewhere inside the pattern. The take profit level is usually derived by taking the difference between the low and high, and in our example, that is 10 big figures, and this is subtracted to the breakout point of 1.15, to derive to a target of 1.05. Most of the time the price will not decline in a straight line, and it might not even reach 1.05, but if the stop is placed correctly then the risk-reward-ratio will remain good, and compensate for all the times when the market experiences a false breakout. A false breakout is when the price leaves the rectangle price range, but eventually forces itself back into the prior price range and starts to trade sideways once again. The pattern below also has a bullish version which looks the same, with the exception that the price trades higher instead of lower.Bearish Rectangle Pattern

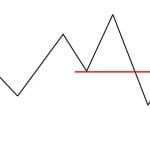
Head and Shoulders Pattern
The head and shoulders pattern is probably the most famous of all classic chart patterns. You will usually find it at the end of a bullish trend, or in the case of a downtrend, you might find the inverse head and shoulders pattern.