

- The Graph price predictions are tilting towards the bearish end as the bulls struggle to preserve the last support before new lows emerge.
The Graph price predictions appear to favour more selling on the asset if today’s price action is anything to go by. The bulls are barely defending the support at 0.12615, which is perilously close to the all-time lows of the asset. This is due to the 6.25% drop suffered on the day, making it three out of four losing sessions. Losses exceeded 5% on Monday and 2.43% on Tuesday, with the GRT/USDT pair barely gaining 0.16% on Wednesday.
The Graph appeared to be coasting at a high of 1.33432 on 9 November 2021. Then the announcement of the discovery of the Omicron variant was all over the news. The Omicron event set off a round of relentless selling on every crypto token in the market. The Graph was one of the worst-hit, as it is down more than 100-fold from the 9 November high.
Despite housing as many as 15 layer-one blockchain networks and hundreds of dApps, The Graph now finds itself in a precarious position where failure to defend the current support will send it to new lows. If any bullish The Graph price predictions are to enter the market, the bulls will require a herculean effort to make it happen. Technically speaking, a bearish pattern is emerging on the daily chart. How does this impact The Graph price predictions?

The Graph Price Prediction
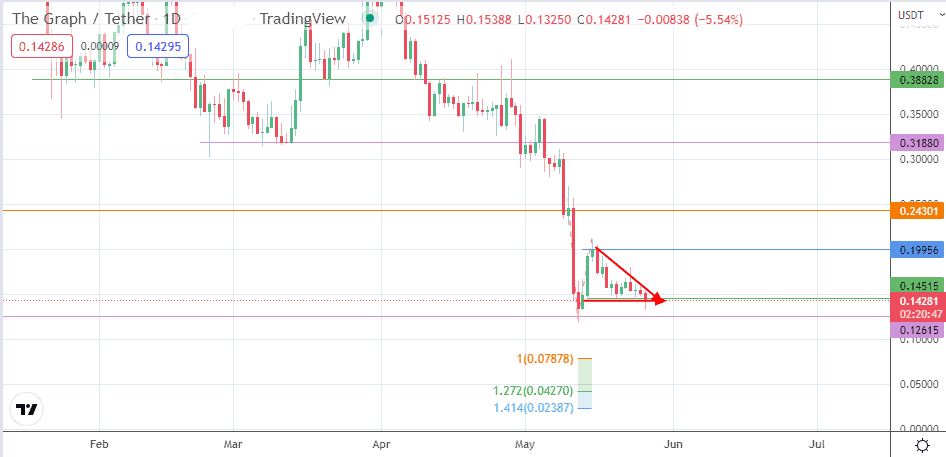
The obvious reaction to a breakdown of the 0.12615 support would be a bearish continuation that targets 0.07878 initially (100% Fibonacci extension from the 9 May high to the 12 May low). This point marks the completion area of the triangle’s measured move. 0.04270 (127.2% Fibonacci extension) is another potential downside target.
On the other hand, a bounce on the 0.14515 support provides the penetration close needed to preserve this support. The bounce needs added momentum to attain 0.19956. 0.24301 becomes a viable target only if the 16 May high at 0.19956 is cleared.
GRT/USDT: Daily Chart