

- Since July 13, the Graph price has been on the rise, surging by 70 percent. Today, the bullish trend looks poised to continue.
Since July 13, the Graph price has been on the rise, surging by 70 percent. Today, the bullish trend looks poised to continue after yesterday’s session, resulting in a drop of 6 percent.
Since its launch, Graph has found a huge user base in the blockchain community due to its functionality of collecting, processing, and storing data from various blockchain applications to facilitate information retrieval. The project has also become popular among blockchain developers, with one of its major applications being to increase of efficiency of decentralized applications.
Today, the Graph has grown to become one of the largest cryptocurrency projects, with a market capitalization of $990 million. It is also ranked as the 54th largest cryptocurrency and, in the past few weeks, has been among the best performing in the industry.
The Graph Price Prediction
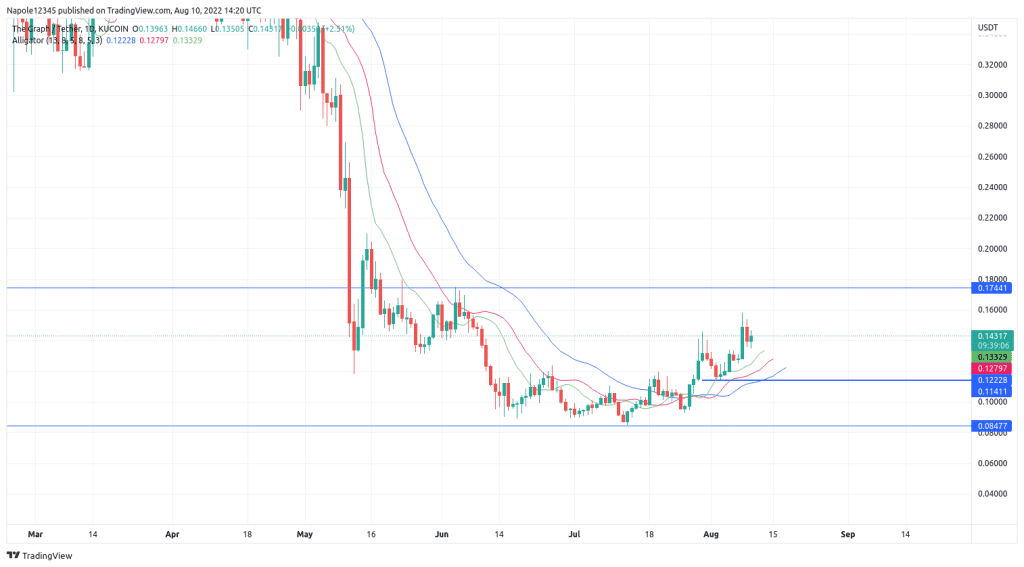
In today’s trading session, the Graph opened the markets trading at $0.13. The intraday trading activity has seen it rise by over 2 percent, and the trend is looking aggressively bullish, meaning there is a high likelihood that we might see prices continuing to rise throughout the session.
The graph’s performance for the past few weeks shows that in July, the crypto rose by 34 percent. The strong bullish trend has also extended into July, where it is already up by 11 percent.

Therefore, using the chart below and basing my analysis on previous price action, I expect the Graph price to continue going up. There is a high likelihood that we will see prices hitting the $0.17 resistance level in the next few trading sessions. It is also likely that the current bullish trend will push the Graph price past the $0.20 price level, which will be its highest since May.
However, should the prices retreat and trade below this week’s price low of $0.12, then my bullish analysis will be invalidated. It will also mean a possible trade to the downside.
The Graph Daily Chart