

- The Gold price could be on the verge of a massive $200 drop back to the March 2020 pandemic low if the poor technical backdrop plays out.
The Gold price could be on the verge of a massive $200 drop back to the March 2020 pandemic low if the poor technical backdrop plays out. The headwinds for the shiny pet rock are mounting up. Yesterday, Jerome Powell gave the first hint that he is changing his stance on inflation from ‘Transitory’ to ‘structural’. As a result, the odds of an interest rate hike in 2022 spiked to 50%, sending bond yields and the dollar flying.
Considering Gold (XAU/USD) is viewed as an efficient hedge against inflation, you could be forgiven for thinking the price would have rallied this year. Despite the rampant inflation across the board, the Gold price is down 8% year-to-date. Furthermore, Gold is changing hands 16% below the August 2020 high of $2,075. Unfortunately for Gold bugs, all the signs indicate the price could be about to enter a devastating bear market.
A challenging enviromnet for Gold
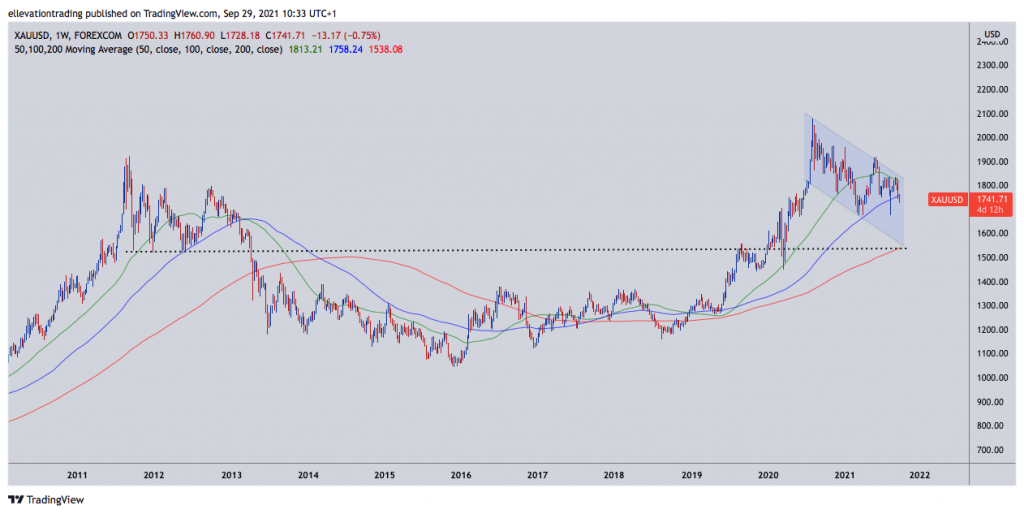
This morning, US Dollar Index futures are trading at 93.80, the highest price since November 2020. Furthermore, short US dollar is one of the most crowded macro trades making it vulnerable to a substantial unwind. If dollar shorts start to cover, it could trigger an extended rally in the greenback, forcing longs to flee Gold. Subsequently, the weekly price chart is beginning to paint a worrying picture for the Gold price. IF XAUUSD finishes this week below $1,758, it will make the first time since December 2018 it has finished beneath the 100-week moving average, which will undoubtedly encourage long term sellers.

If Gold closes below $1,758 on Friday, I expect to see a wave of selling hit the market next week. My initial downside target is the triple-bottom lows at around $1,675. However, a steeper sell-off could drive the price down to the 2012 lows, which align with the 200-week moving average at $1,538. Now, of course, this bearish view relies on the fed upping the hawkish rhetoric and the market pricing it into the dollar and bonds. Therefore, traders should pay close attention to Fed Chair Powell’s stance on inflation. If the Fed adopt a more dovish tone in the weeks ahead, the bearish prediction becomes invalid and swings back to neutral, awaiting further inputs.
Gold Price Chart (Weekly)
For more market insights, follow Elliott on Twitter.