


- BT share price slumped 4% yesterday, to a must-hold technical level. And despite the sell-off looking overdone, BT Group (LON: BT.A) is vulnerable.
BT share price slumped 4% yesterday, to a must-hold technical level. And despite the sell-off looking overdone, BT Group (LON: BT.A) is vulnerable. On Thursday, the British Telcom multination continued its downward path, finishing the day at 162.15p, the lowest level since May.
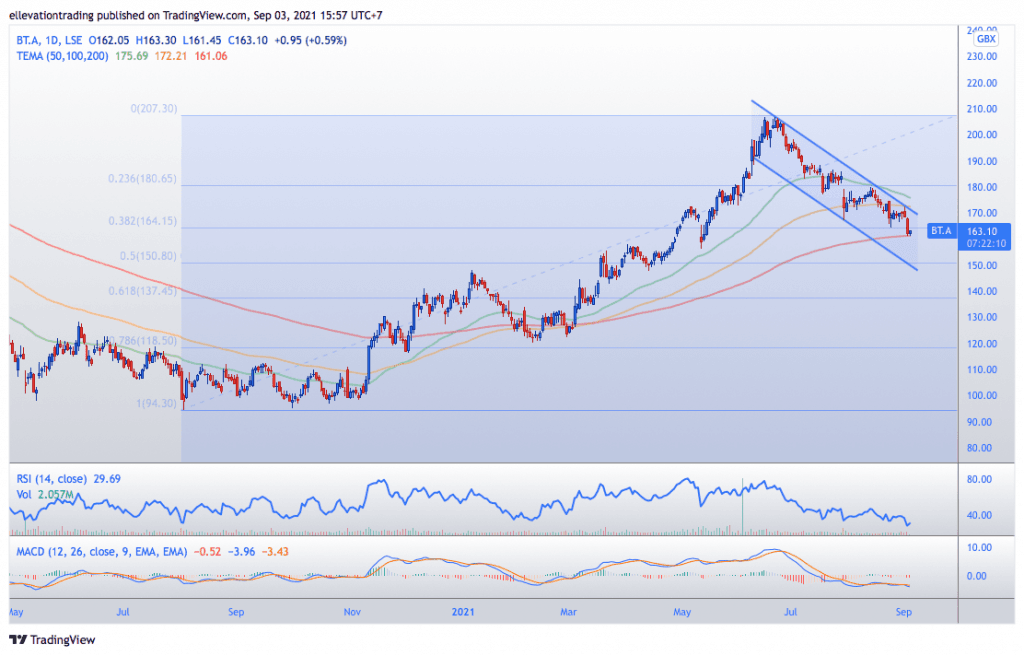
The BT share price is now down more than 20% from the June high and a whopping 68% below the highest ever price of 502p. What’s more, yesterday, BT closed just short of the 200-day moving average at 161.06p. And if the price drops below the indicator by today’s close, the decline may go into overdrive next week.
Although the first half of the year proved fruitful for BT, the second half has been just the opposite. In March, regulator Ofcom gave BT the go-ahead to charge customers more to help fund its £12bn national fibre-optic rollouts. As a result, the BT share price gained almost 60% to 206.70p in the four months that followed. However, a revenue miss and accusations of unfair contract pricing have weighed heavily since. Even the appointment of former ITV and Asos head honcho Adam Crozier to Chairman has done little to stem the bleed. This has left investors feeling fretful, and rightly so. The price action is certainly depressing, and unless BT can turn things around very soon, its valuation may get lower still.

Technical Analysis
Looking at the daily chart, it’s clear to see BT has been steadily trending lower since the June high. Furthermore, strong overhead resistance is offered by a descending trend line. The trend aligns with the 100-day moving average at 172.20p to become the first significant resistance. The BT Group price forecast remains bearish until the price clears this trend resistance at 172.20p. Furthermore, the price is nudging against the 200 DMA at 161.05p, and a close below this level today will constitute a confirmed breakdown. On that basis, the outlook turns sharply lower below 161.0p.
BT Share Price Chart (Daily)
For more market insights, follow Elliott on Twitter.