Tesla (NASDAQ: TSLA) share price is surging once again as the US equities rebound. Tesla stock price is up 18% from its March lows and retesting one of the major resistances on its chart. Our analysis shows that the moment of truth is here for the stock of the biggest EV maker.
After a 6.24% price surge on Friday, Tesla stock price lost almost all of its gains on Monday. The shares slid by 6.12% during the first trading session of the week as Nasdaq 100 index closed in the red. This rejection might result in a bigger correction if the price doesn’t reclaim $200 soon.
China-Made Tesla Sales Surge In March
Data from the China Passenger Car Association reveals that Tesla sales in China are surging. According to this data, Elon Musk’s electric car maker delivered 88,869 Chinese-made vehicles in March 2023. This translates into a 35% increase on a YoY basis and a 19.4% increase on an MoM basis. In February 2023, the company delivered 74,402 China-made vehicles.
Despite an increase in the sales of Chinese-made vehicles, the first-quarter deliveries of Tesla remained 6% lower. This news was the major catalyst behind the sell-off on Monday. On Tuesday, Tesla share price is up 0.79% in the pre-market. This indicates that the price can increase even more once the markets open.
Tesla Share Price Can Reverse From Here
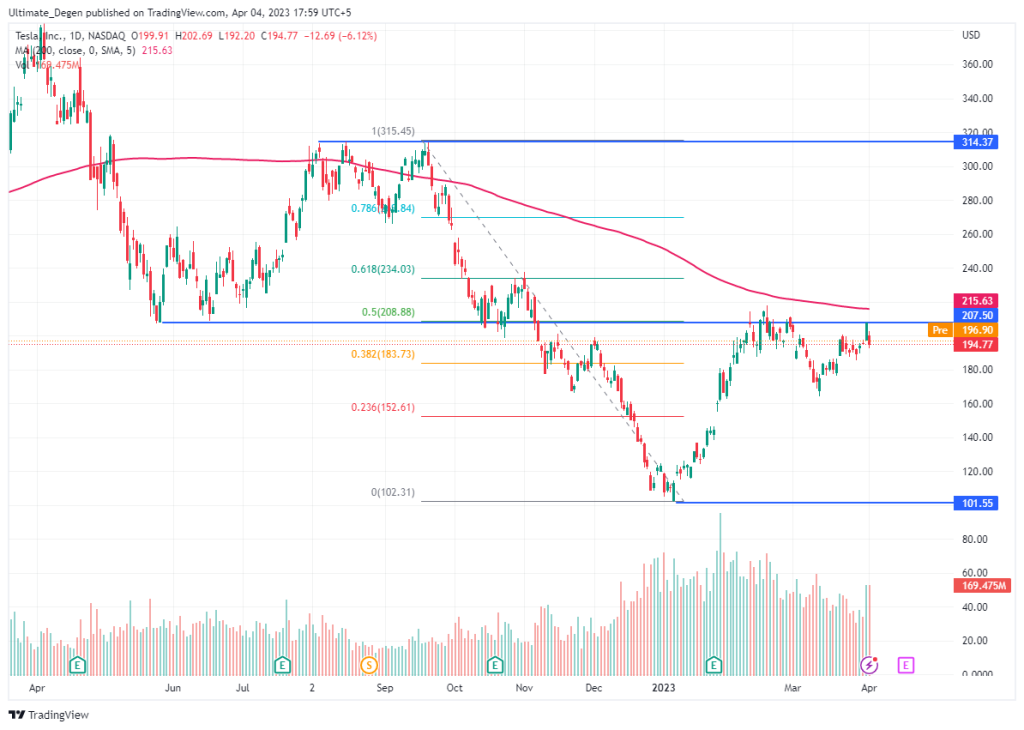
Even though Tesla stock (NASDAQ: TSLA) is up 18% from its March lows, it is yet to reclaim a key resistance level on its chart. This is the $208 price level which is previous support now acting as a resistance. A reclaim of this level can be very bullish for the Tesla share price forecast, but I don’t see it happening yet.
The reason why I’m expecting a pullback from current prices is due to multiple confluences. Firstly, the $208 level lies at the 0.5 Fib retracement level. Secondly, it is previous support that has now become resistance. Thirdly, it lies just below the 200-day moving average, which is very hard to claim.