Investors are getting greedy again, which could be positive for the Shiba Inu price. The Bitcoin fear and greed index has moved to 56, while the one by CNN Money has moved to the neutral zone. This performance is happening as optimism about crypto adoption converges with the rising fears of the inverted yield curve rise. SHIB is trading at $0.000028, which is the highest since March 1.
Investors are getting greedy.
There are early signs that investors are getting greedy, as evidenced by the stock and cryptocurrencies market performance. The Dow Jones and Nasdaq 100 indices have risen in the past two weeks and are even eying their YTD highs. At the same time, cryptocurrency prices have also risen, with Bitcoin nearing the psychological level of $50,000.
Therefore, the performance of the Shiba Inu price is mostly because of the overall greed in the market. Also, investors are buying cryptocurrencies because of the hope that their prices have bottomed. As a result, as I will explain below, the SHIB token found strong support recently.
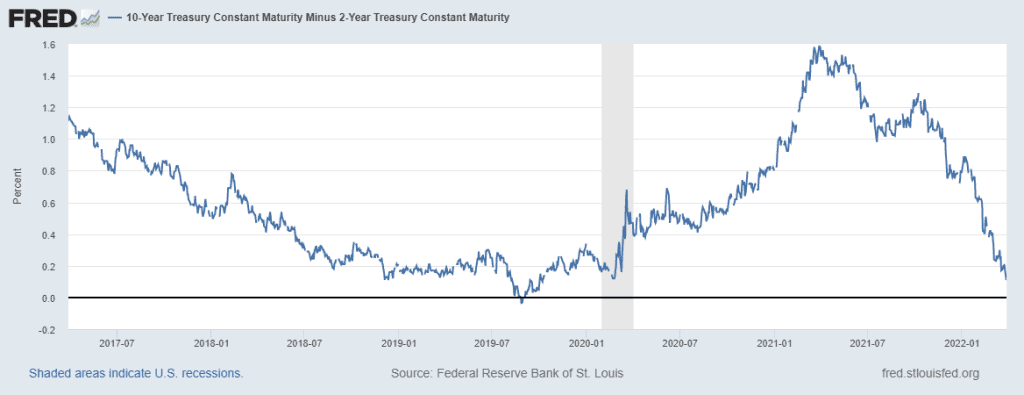
Another reason why the SHIB price has risen is that the yield curve inverted for the first time on Monday. Before that, there have been signs of this inversion for a while, as shown in the chart below. While an inversion is a bearish thing, assets are likely to rise because investors expect the Federal Reserve to slam the brakes on rate hikes.
Meanwhile, on-chain data show that Shiba Inu’s activity is rising. The number of transactions is slowly increasing while whales have continued accumulating. Notably, a quick look at Google shows that the number of keyword searches has been on an upward trend in the past few days.
Shiba Inu price prediction
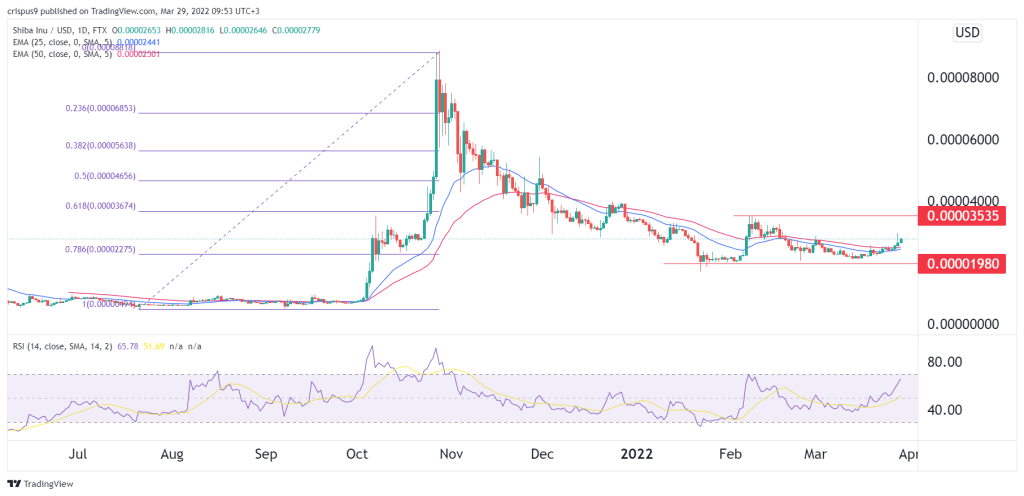
The SHIB price found strong support at about $0.00001980. It has struggled to move below this level several times, signalling that it may have bottomed. The coin has moved slightly above the 78.6% Fibonacci retracement level. It is now approaching the important resistance level at $0.000035, the highest level on February 7 and the 61.8% retracement point.
Therefore, while these moves are positive, it is still too early to determine whether the bullish trend will continue. However, more gains will be confirmed if the price moves above $0.000035. On the flip side, a drop below the support at $0.00001980 will mean that there are still sellers in the market.