
- The BHEL share price surged 10% after a blowout Q4 earnings report that showed revenue and profits more than doubling YoY.
Current Setup and Live Chart
BHEL is the stock symbol of Bharat Heavy Electricals Ltd. The BHEL share price started the week on a solid footing and strong momentum on the back of an earnings report that blew estimates out of the water.
The big story for the Bhel share price is the 10% surge in the stock price on the day after the company released stellar Q4 earnings results that beat market estimates.
According to the earnings report, revenue came in at Rs 12,310 crore, slightly missing estimates of Rs 12,398.3 crore. Record order inflows, major project wins, and its diversification program boosted this 37% YoY growth in FY2026. The company’s sustainability initiatives also boosted performance for the year. The company’s profit after tax also rose to Rs 1,283 crore for the quarter, surpassing estimates of Rs 826 crore. This was more than double the profit for the same quarter the previous year, which had only registered at Rs 504 crore.
EBIDTA also more than doubled, rising to Rs 1,754 from Rs 834 a year ago. Bharat Electricals Ltd also saw its margin expand from 9.2% to 14.2% YoY. A final dividend of Rs 1.40 per share for FY2026 has been recommended.
A look at the chart shows that the Bhel share price has risen by more than 70% over the past year, delivering solid returns for its shareholders and even outperforming the Nifty 50 index, which declined 0.9% over the same period. The BHEL share price now sits at 18-year highs.
The BHEL share price story is a solid example of an earnings-driven re-rating story, albeit with elevated volatility.
BHEL Share Price: Macro Drivers
1) Earnings
Profits and execution are moving in tandem. Improvements in execution have been shown to affect the company’s profit profile directly. Q3 had previously provided signals to this effect, with profits more than tripling YoY. The Q4 results merely reinforced the inflection that Q3 had already shown.
2) Order Flow
The record order book reported in the earnings call came largely from the power division (large wins) and from its industrial division, which services transport, process, and defense industries. The BHEL management also publicized some of its prominent orders from the third quarter, including contracts for hydro E&M, transmission equipment, thermal EPC, and refinery boiler packages.
BHEL Price Catalysts for the Week
1. Follow-through buying vs profit-taking

It is a common phenomenon to see profit-taking after a large surge following the release of blowout earnings from Bharat Heavy Electricals Ltd. This week, it remains to be seen whether any dips are bought into to send the price to new highs, or whether more profit-taking will follow.
2. Order-book /execution headlines
Any headlines indicating an expansion of the order book via large contract wins, or a faster execution pace, will drive positive sentiment on margin sustainability, potentially boosting the BHEL share price. This is because BHEL is trading within an earnings + order-cycle regime.
3. Valuation
After a strong upside move, further continuity now depends on whether the improvement in profitability seen in Q4 can be repeated in subsequent quarters or is a one-off event. There is already commentary to that effect, and any doubts can cap the upside trend.
BHEL Share Price Forecast Scenarios
Base case: A choppy consolidation at higher price levels. This is because the market is still digesting the earnings numbers and the gains, even as bias remains constructive.
Bull case: a continuation of the uptrend move, triggered by continued follow-through buying and headlines pointing to more contract winds and improved sentiment around margin resilience and earnings sustainability.
Bear case: A pullback due to profit-taking may be triggered if the market believes the Q4 performance will be hard to repeat on a quarter-to-quarter basis. This is not expected to be a full reversal, but a retracement to support levels.
BHEL Share Price: Technical Outlook
The 8 August 2025-29 January 2026 upswing produced the Fibonacci extension levels at 333.20 (27% level) and the 61.8% extension at 368.25. The price surge has uncapped these barriers. However, the upside momentum fell short of the 406.70 price level, which was formed by the 100% extension level. The retracement now looks set to test the 61.8% mark at 368.25. A breakdown here brings the 333.20 pivot into the mix as the next downside target.
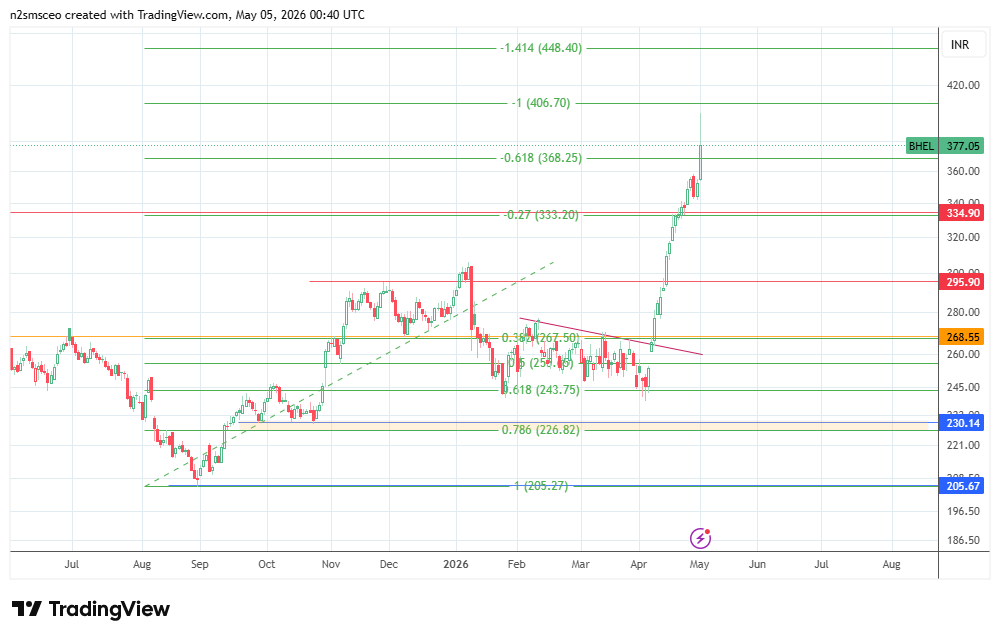
However, if follow-through buying leads to a bounce and the uncapping of the 406.70 resistance, the next upside target is the 141.4% Fibonacci extension at 448.40.
