
- The Adani Power share price is seeing new record highs as the markets price in expectations of increased power demand this summer.
Current Setup and Live Chart
Adani Power is an Indian power company stock. The Adani Power share price is trading within a thermal-fuel, summer-demand regime, where the stock is moving on expectations that rising temperatures will drive power demand for cooling systems heading into the hot summer months.
In terms of price action, the recent tape has seen a lot of volatility, with the price hitting a new record high at ₹193.37. Prices had fallen to ₹130 in January 2026, but the company’s stock was not affected by the March 2026 oil shock. Rather, it thrived as its reliance on large-scale coal-fired thermal power plants reduced its reliance on oil compared to other power plants that use Liquefied Natural Gas (LNG).
Adani Power Share Price: Macro Drivers
Here are the macro fundamentals behind the Adani Power share price.
1) Summer Demand Buildup
Energy companies typically see more energy demand in the hot summer months, due to the increased use of cooling systems. Big energy names such as Adani Power are currently seeing a summer load buildup, which is a demand tailwind for the stock.
2) Lower Repricing of Coal Availability Risk
The markets are repricing coal availability risks lower after India announced it had about 220 million tons of coal in stock. This is said to be sufficient to generate 24 days’ worth of electricity and points to greater grid stability. It also reduced the need for panic buying associated with shortage rumors as demand rises. Excess demand due to panic buying tends to create artificial shortages, and adequate coal stocks mitigate the risk, hence the lower repricing of coal availability risks.
3) Indian Power Pricing Dynamics
Power pricing in India has generally trended lower, creating an earnings-sensitive headline in this regard. In its third-quarter FY26 update, Adani Power stated that power pricing had flattened YoY, with a double-digit drop in market-clearing prices.
4) Lower Profits vs Summer Demand Expectations

Adani Power’s Q3 FY26 profits dropped YoY, a decline the company blamed on lower one-time income compared to the prior-year quarter.
Much of the weighting in the recent Adani Power share price upsurge comes from forward-loading of summer demand expectations, not the quarterly results.
Adani Power Share Price Catalysts for the Week
1. Rising temperatures vs demand prints: Thermal stocks like Adani Power will see fundamental support from higher peak-load demand.
2.Coal inventory and logistics headlines: India has already flagged coal stocks as sufficient at the national level. But that is at the storage level. Will the supply chain be as efficient as needed to ensure the same level of sufficiency at the end user? This is something the markets will be watching.
3. Pricing: Tighter supply induces higher prices, and this has the most direct impact on the Adani share price. Soft pricing caps rallies.
Adani Power Forecast Scenarios
Base case: Most likely to showcase choppy but constructive price action. Support comes from optimism around additional demand in the summer months. However, there could be pullbacks due to market risk-off factors and muted spot prices.
Bull case: The continuation of the current breakout move that has sent the stock to new highs can be triggered by signs of tighter power markets (with spot prices rising) and a demand spike driven by higher temperatures.
Bear case: a cooling of the current upsurge could result from unexpected lower temperatures, softer pricing, or any negative policy or regulatory headlines.
Adani Power Share Price Technical Outlook
The recent upsurge that has uncapped the 3 June 2024 high at 182.78 looks set to aim for the 27% Fibonacci extension of the 27 February 2023 – 3 June 2024 upswing at 219.88. A break of this level targets the 61.8% extension at 272.35.
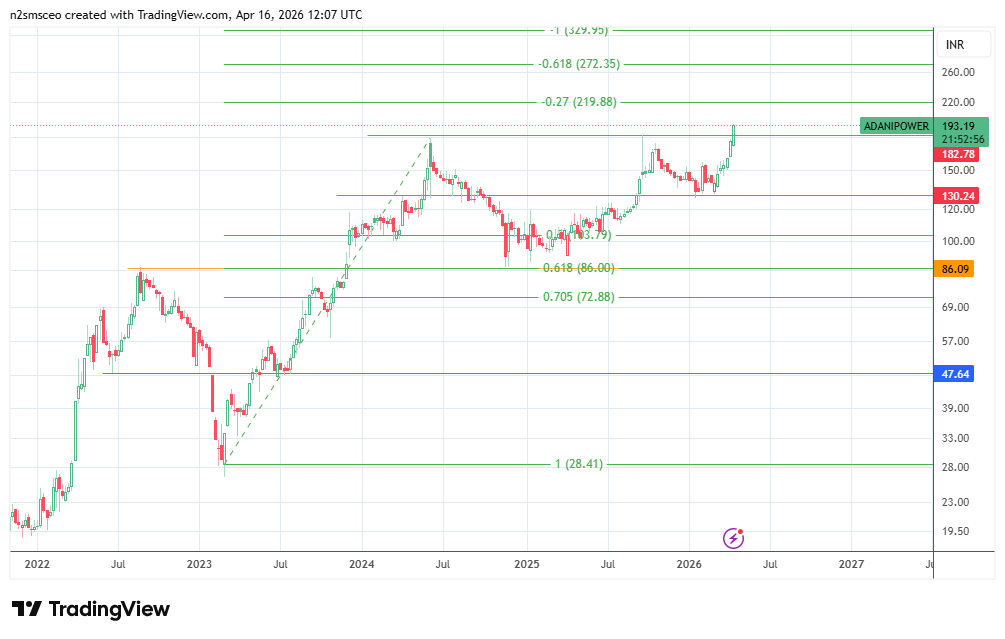
However, a decline below 182.78 would support a retreat to the recent lows at 130.24. Below this, additional pivots are found at the 50% and 61.8% Fibonacci retracement levels at 103.79 and 86.00, respectively. The latter houses the recent lows of 18 November 2024.