


- Heightened expectations on an earlier-than-expected rate hike are driving the S&P 500 lower as Wednesday's trading starts.
Market expectations of an earlier-than-scheduled rate hike are overwhelming any positive sentiment around the lowest jobless claims since 1969, as the S&P 500 index has opened lower this Wednesday.
Ahead of the Thanksgiving Holiday, the release of the Initial Jobless Claims came a day earlier. A figure of 199K represented a steep drop from the previous figure of 270K and beat estimates of a drop to 259K.
However, the Fed’s key inflation metric, the Core PCE Price Index (monthly) rose from 0.2% to 0.4% as expected. This number reinforces the market belief that US inflation is no longer transitory and would need more hawkish action from the Fed. Two Fed members have opined in the last week that the Fed may need to speed up its tapering program, spurring speculations that the first of the rate-hike liftoffs could come in 2022.
This hawkish expectation is impacting the US stock markets, leading to the negative intraday start to the day.
S&P 500 Index Outlook
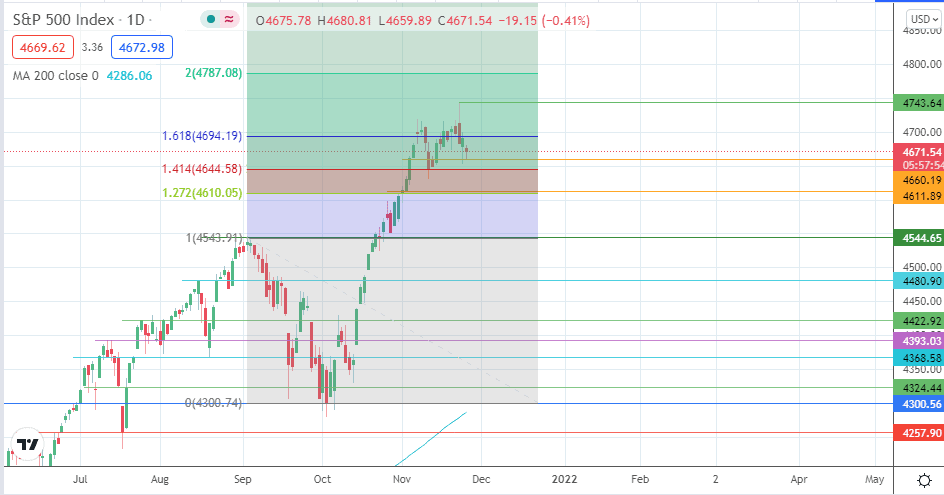
The intraday drop has touched off the support at 4660.19, keeping price range-bound between this level and the 4694.19 resistance (161.8% Fibonacci extension and 15/23 November highs. A decline below 4660.19 opens the door towards 4611.89, with 4544.65 serving as an additional downside target.

On the other hand, a break of 4694.19 allows for a potential march to retest the all-time high at 4743.83. A break of this level may open the door for the 200% Fibonacci extension on the daily chart at 4787.08 to become the new target to the north.
S&P 500 Index: Daily Chart
Follow Eno on Twitter.