- The Royal Dutch Shell share price made a bearish breakout on Monday as fears of the Omicron variant rose. The RDSB stock is trading at 1,574p
The Royal Dutch Shell share price made a bearish breakout on Monday as fears of the Omicron variant rose. The RDSB stock is trading at 1,574p, which is the lowest it has been since September 27th. It has crashed by more than 14% from its highest level in October. Other oil and gas shares like BP, Occidental, ExxonMobil, and Chevron also declined sharply.
Shell is one of the biggest oil and gas companies in the world. The firm is involved in upstream, midstream, and even downstream. Therefore, the company usually does well when the price of oil and gas is rising.
This explains why the Shell share price surged to a year-to-date high of 1,793p when the price of Brent surged to a year-to-date high of $86. Also, the company benefited when the price of natural gas surged because of the shortage.
Now, the price of crude oil has slumped as investors remain concerned about the Omicron variant. These worries stem from the fact that many countries are starting to implement new restrictions in a bid to curb the virus. For example, there are rumours that the UK government will impose new lockdown after Christmas.
Still, in my view, I expect that the impact of these actions on companies like Shell and BP will be relatively limited. Besides, the firms have already learnt their lesson from last year’s crash. Most importantly, a company like Shell will actually benefit because of its secretive trading business.

Royal Dutch Shell share price forecast
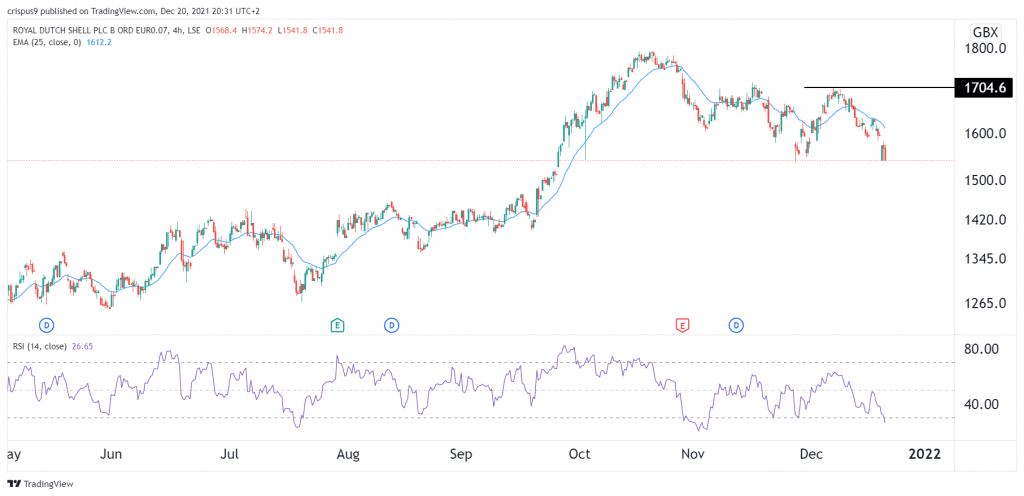
A closer look at the four-hour chart shows that the RDSB share price shows that the stock has retreated sharply lately. This decline was in line with my previous estimate. At the same time, the chart shows that it has formed a double-bottom pattern whose upper chin is at about 1,700p. A double-bottom pattern is usually a bullish sign.
Therefore, while the stock is below the 25-day and 50-day moving averages, a contrarian case can be made. It will only break out higher if bulls manage to stay above of the support at 1,570p. A drop below this price will send a signal that there are more sellers in the market, who will be keen to push it substantially lower.