

- The downgrade of the Robinhood share price target from $11 to $7 has sent the stock into record low territory.
The Robinhood share price has dipped 4.43% in premarket trading, which could send the stock to new record lows if the bulls fail to resist the price drop. This premarket selloff follows yesterday’s downgrade of the stock by investment bank JP Morgan.
Ken Worthington, an analyst at JP Morgan, cut the Robinhood share price target from $11 to $7 on Tuesday based on the company’s lower margin balances and weaker trader activity outlook. In addition, the analyst indicated that the broker’s performance indices, released in May, were consistent with the bank’s May research notes on the stock. In those notes, JP Morgan had indicated that the activity levels on the broker’s app could be undermined by customer underperformance.
Robinhood posted net sales of $1.5billion in May, representing an organic growth rate of 22%. However, clients of Robinhood lost 900bps at a time when the S&P 500 was up 18bps, even in a market environment that could be classified as underwhelming. Margin balances also dropped steeply by one-fifth and now stand at $4.2 billion. JP Morgan has maintained an underweight rating for Robinhood as regulatory risks, and market deterioration continue to constitute ever-present headwinds.
Technically speaking, the decline of 13 June formed a downside gap, sending the stock to new all-time lows at 7.02. The stock closed flat on the next candle, but the drop in premarket price looks set to give the Robinhood share price a lower open into lower record territory.

Robinhood Share Price Forecast
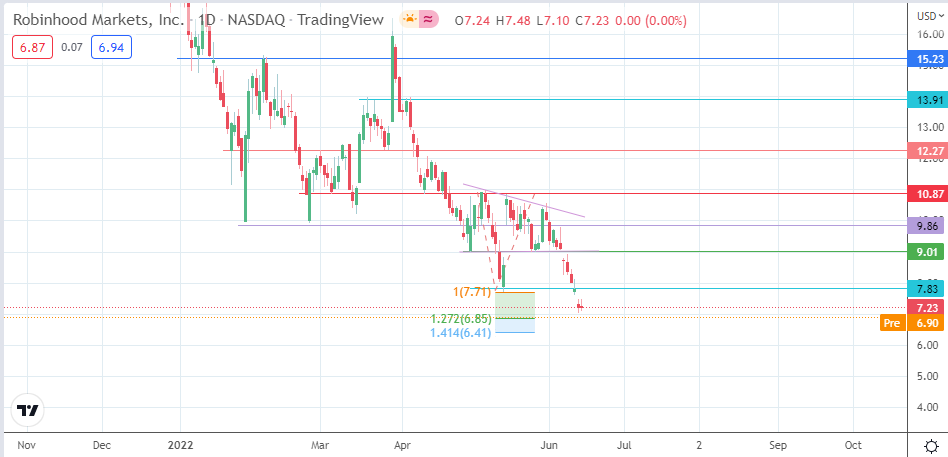
The drop in the premarket price takes the Robinhood share price close to the 127.2% Fibonacci retracement level at 6.85, which is in line to be the next valid support. A drop below this level sends the pair lower, targeting the 141.4% Fibonacci extension at 6.41. 6.00 could become another reference pivot, serving as a psychological price mark.
On the flip side, a recovery in the price above the 7.83 resistance covers the downside gap and opens the door for a push toward 9.01 (29 April and 24 May lows). Above this level, additional resistance barriers are seen at 9.86 and 10.87, where the 5 May and 13 May 2022 highs are found. 12.27 serves as an additional harvest point for the bulls if the price action transcends 10.87.
HOOD: Daily Chart