


- The Polkadot price has not only recovered the damage it took last week. After months of trying, DOT has almost erased May's historic crash.
The Polkadot price has not only recovered the damage it took last week. After months of trying, DOT has almost erased May’s historic crash. Yesterday’s high price of $38.76 marks an incredible turnaround for Polkadot (DOT/USD). After getting slammed 40% during last Tuesday’s sell-off, Polkadot has been on a tear, and by yesterday was 75% higher and trading at a price last seen on May 19th.
As a result of the recent gains, Polkadot’s market cap has increased by a staggering $26 billion to $36b from just $10b in July. This ranks DOT as the 8th-largest cryptocurrency ahead of Dogecoin (DOGE/USD). However, for DOT to have any chances of increasing its value in the short term, the price must first overcome significant overhead resistance.
DOT Price Analysis
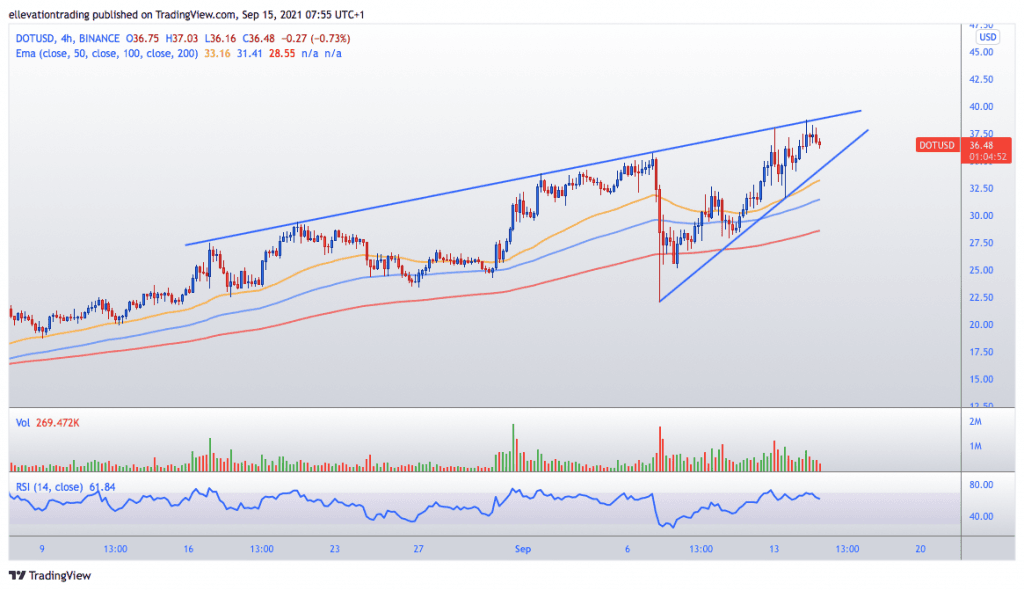
The four-hour chart shows that a rising trend line has capped the price since the middle of August. The trend has been a constant source of rejection for the price and the catalyst for last week’s technical reversal. Furthermore, the trend which is currently seen at $39.00, proved the high for the last two days.

Therefore, as long as Polkadot stays below the trend line, a correction is possible. In that event, some obvious downside targets emerge. A rising trend line at $34.00 from last weeks low is the first support level. Below that, the 21st of August high around $29.50 offers the next level of support. However, if the Polkadot price manages to clear $39.00 an extension to the $42.00-$45.00 is probable. Furthermore, above $45.00 and the all-time high of $49.77 could be under threat.
Polkadot Price Chart (4-Hour)
For more market insights, follow Elliott on Twitter.