Earlier on Wednesday, the crypto market was all green after recovering some of its losses.
The current global crypto market cap was $2.00T, a 2.35% increase in the last 24hr. Bitcoin was up 1.08%, ETH had risen 3.46%, while DOT gained 6.67%.
MOONBEAM Completes its Launch on POLKADOT
Yesterday, Moonbean became the first para chain smart contract on Polkadot and shared their excitement on Twitter through the official Moonbean handle.
Moonbeam is LIVE on polkadot ! We are excited to announce that Moonbeam is the first fully operational para chain on Polkadot. Moonbeam will bring many new integrations, activity & users to light up Polkadot’s ecosystem.”
Moonbeam is a smart contract platform on Polkadot that offers more features than Ethereum by providing staking, on-chain governance, and cross-chain integrations.
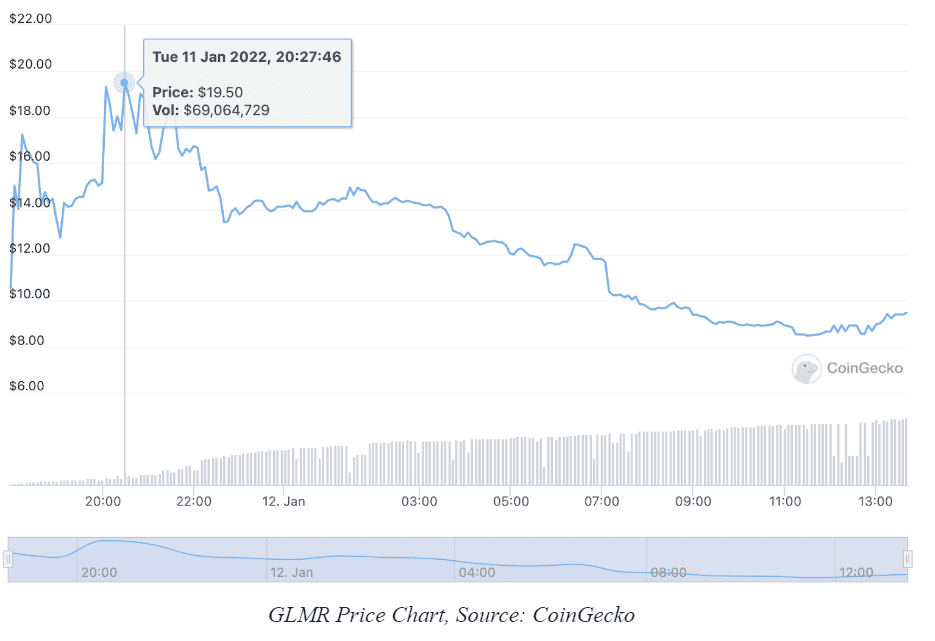
Soon after the launch, Moonbeam altcoin (GLMR), initially priced at $10.57, surged 84.4% to a high of $19.50. At the time of writing, the GLMR token was trading at $9.65 after giving up all of yesterday’s gains.
Polkadot price prediction:
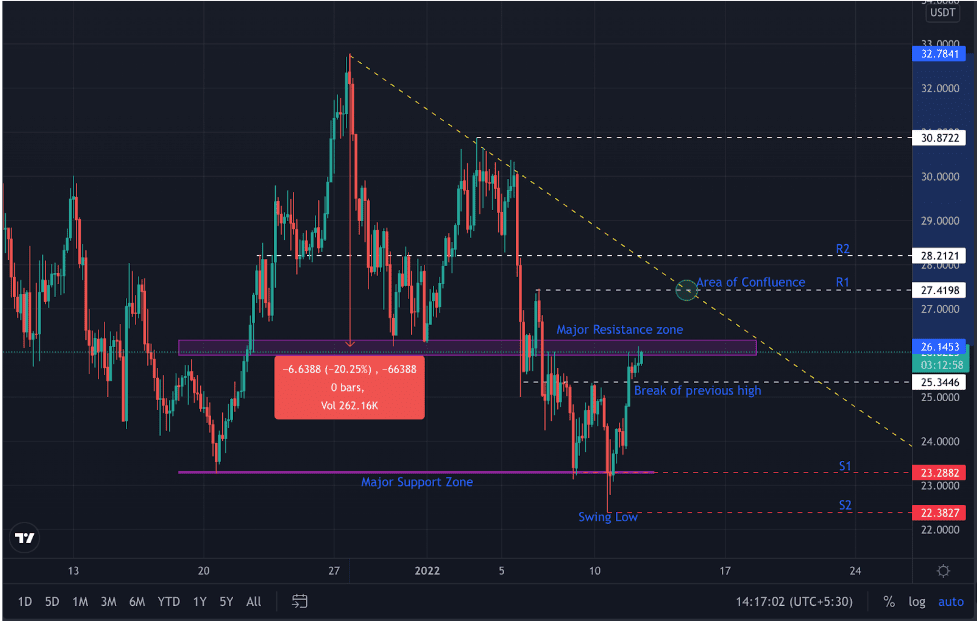
Polkadot was trading at $25.71 which is up by 6.67% in the previous 24hrs.
On the DOT/USDT 4hr chart, we can see that the market structure is bearish; however, the price has been moving up since yesterday.
Previously on December 27th, DOT formed a major high at $32.75 but soon afterwards came down to $26.13, dropping cutting almost 20.26%. After the swing low formation at $26.13, the price started to move up and formed a new swing high at $38.17 on January 3, 2022.
The price then came down and formed a new lower low after breaking the support zone at $26.28 and finally stopping at $22.38.
Currently, the price is moving up after breaking the high at $25.34 formed on 9th January. The price is now near a major resistance zone, and if the price breaks above the zone, it may reach the first resistance zone(R1) at $27.41. However, if the price fails to break the R1, it may fall to $25.34.
The key level is $27.41 as it is a confluence area where both the trendline and resistance zone meet.
DOT/USD 4hr Chart